Day Trading Blog

Open post free trading tools picture

FREE Trading Tools For Beginners • Top 5 Tools To Use

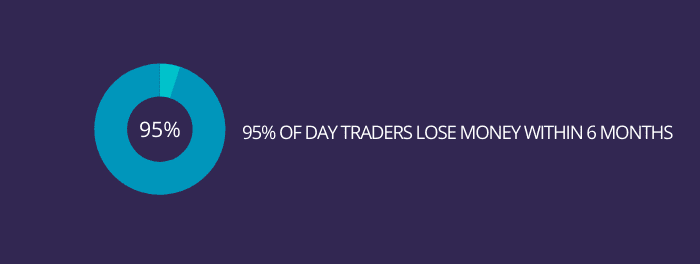
As a beginner day trader, having access to free trading tools is very beneficial. It is important that you are able to save money wherever you can. After all, trading is a business. If you are spending too much money early, you are more likely to join the 95% of traders who fail.

The easiest way to save money is to use free trading tools.

Here are the top 5 free trading tools that are awesome for beginner day traders.

Free Trading Tools #1: Finviz.com

What It Is

Finviz is a web-based stock market research platform that makes market information readily available to traders and investors. The website offers a ton of free tools that you can use to generate trade ideas and find opportunities whether you’re trading stocks, forex, or futures.

I personally use Finviz.com almost every day to find and verify the float of whatever small cap I am trading. I also use it to identify what percent of the float is short, and a few other key metrics.

When you first land on Finviz, you’ll see a snapshot of the 3 leading US indexes, a list of the top gainers as well as top losers for the trading day, and lastly an overall view of different industries and how the largest companies within them performed that day.
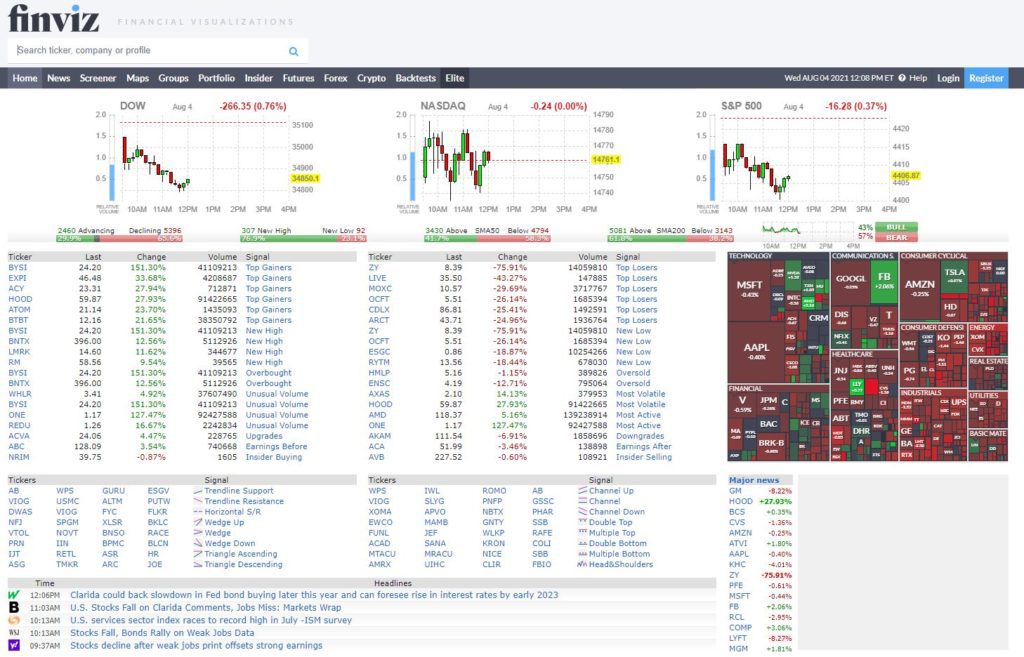
Finviz - Home

Finviz.com Stock Summary

If you type in a specific stocks ticker into the top search bar, you’ll be brought to the Stock Summary page.

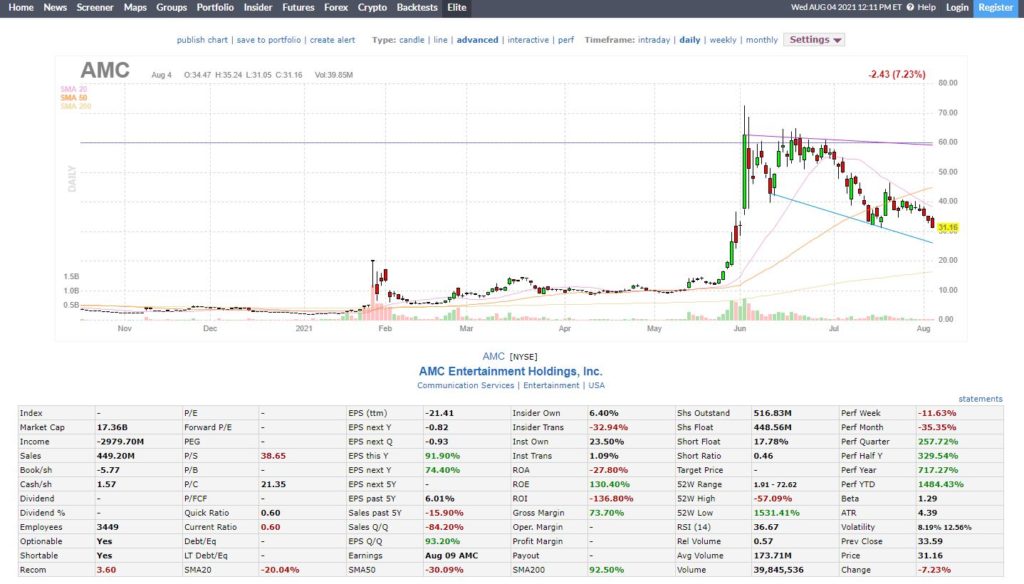
Here is the Summary for AMC:
Finviz - Stock Summary

This has almost all the information that you’ll ever need to know for that stock. You’ll see a quick view of its daily chart which is very helpful, and below that you’ll see what sector and broader market they are positioned in. Underneath that there is a huge table with every metric available. Some key ones that I use daily for small cap day trading are Float, Short Float, and Institutional ownership.


As a general key, any stock that has less than 10 million shares in its float is considered a low float and less than 1 million shares would be a micro float. Short float is important to keep in mind, because as the huge squeezes in GME, AMC, EXPR and other r/WallStreetBets meme stocks showed us, retail traders love to pump stocks with a large amount of shorts compared to its float.

If you lean more on the side of swing trading or investing, then there are a lot of metrics here that I’m sure you’d consider in your trading as well. You can see the Book value per share, their dividends, EPS, and a ton of other metrics that you can check out for yourself.

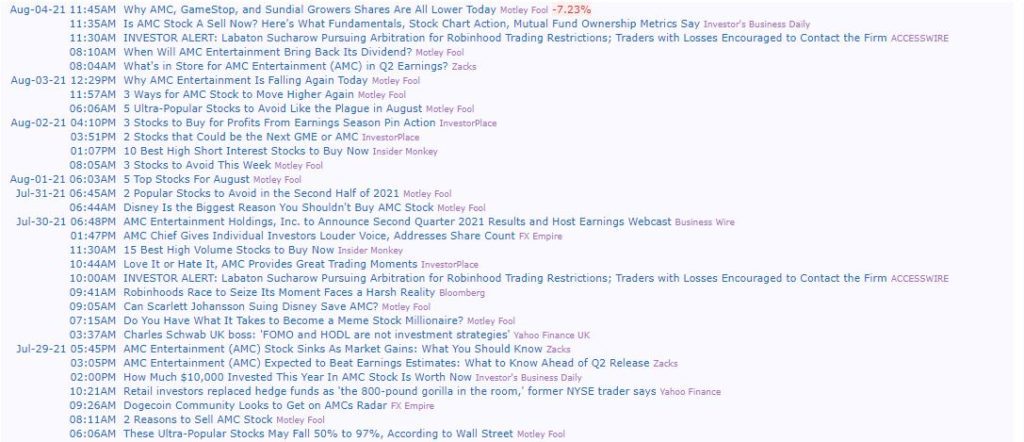
Below all of this information, you’ll see an extensive list of all the news releases and press releases that are tied to this company.
Finviz - News

I typically don’t come here for news specifically, but its nice to know that this section exists in case my ThinkOrSwim feed or my BamSEC research is missing something.

Finviz.com Free Stock Screener

The last free trading tool that we’ll cover on Finviz.com is their free stock screener. You can navigate to the stock screener using the top menu bar once you’re on the website.

Finviz - Select Screener

For being a free screener, this has a ton of parameters that you can filter for, and you can get extremely technical with your scans. I definitely recommend that you go through all of the different filters yourself and decide if any of them would be useful for you to scan for.

My general philosophy with scanners and screeners is to cast a “large net” in order to see a ton of stocks that might have potential. This means that a lot of results in my scans will be duds. However I have learned that being too specific with scanner criteria can cause you to miss stocks that fall just outside of your scans.

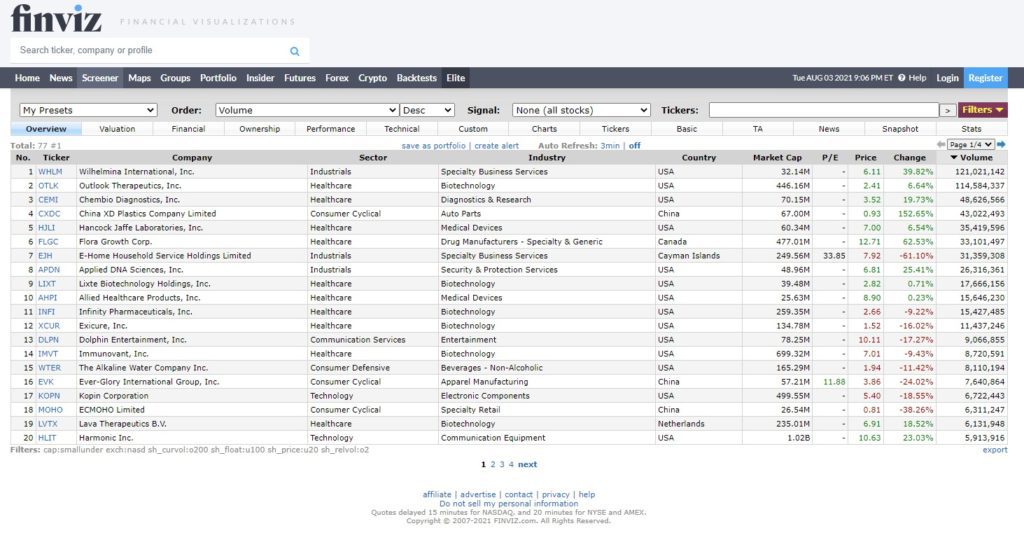
For example, you could pretty much copy the exact settings that I use from my Scanz video:

  • Exchange: NASDAQ
  • Market Cap: -Small (Under $2bln)
  • Relative Volume: Over 2
  • Float: Under 100m
  • Current Volume: Over 200k
  • Price: Under $20Finviz - Screener Settings

These filters will cast a broad net over a ton of ‘small cap’ stocks that you can then go into individually and research. The scan sorts in alphabetical order of ticker symbols by default. But you can simply press the column headers to rank to your liking. Ranking by volume is the best approach to find actively traded stocks first.
Finviz - Scanner Results

You can take your research a step further by pressing the “charts” tab to view daily charts of all of your scan results.
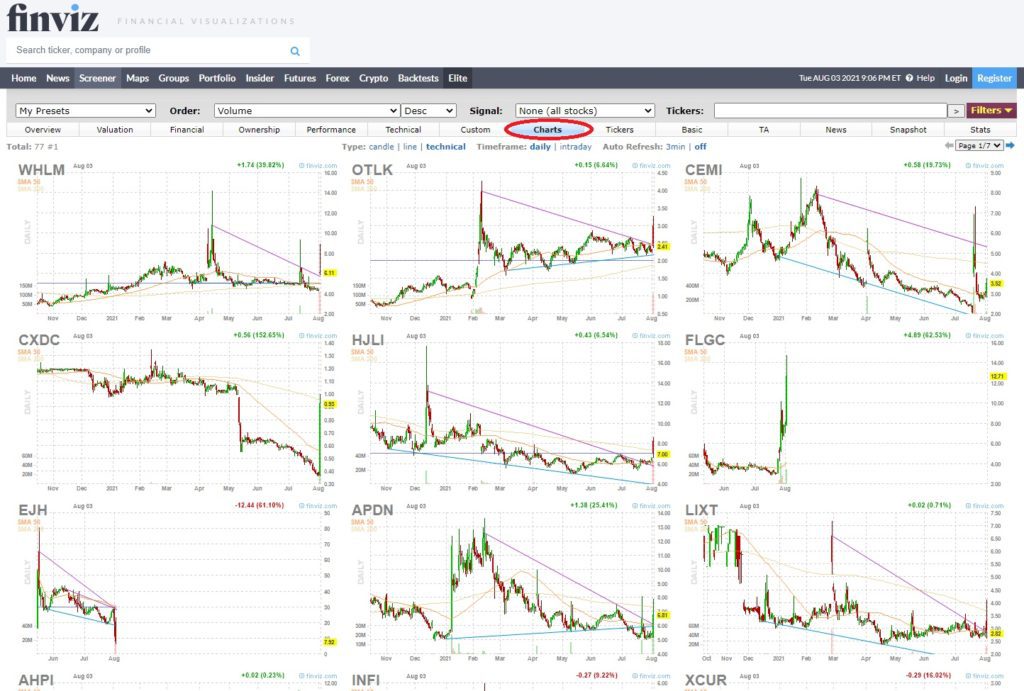
Chart view of finviz scanner results

If you don’t want all of the indicators on the chart, just press “Candle” or “Line” and then you can change from Daily, Weekly, or Monthly charts as you desire.

This chart feature is a hidden gem. I have wasted lots of time just by typing in all of my scan results into my brokers’ chart feed, just to be uninterested in like 80% of the charts. Having a quick view of all of the charts immediately can speed up the process for you newer day traders.

You’ll be able to quickly identify if the chart has ‘good potential’ by viewing its trend, seeing how much resistance is overhead, and just be able to get a feel for the price action before you commit to researching the stock further.

Free Trading Tools #2: BamSEC.com

What It Is

BamSEC is an amazing website, especially for small cap day traders.

This website allows you to view all of the companies SEC filings in a very clear and concise manner.
Overview of the Bamsec.com home page

Back in the day, we use to just have to go to the SEC website and be met with a jumbled mess of all filings in one table, with no easy way to sort through them.

However on BamSEC, filings are split into a few important categories:

  • Financials:  Quarterly and annual earnings reports
  • News: Displays all of  the 8k filings for news releases
  • Prospectuses and Registrations: View offerings and other types of share dilution
  • Proxies: Shows invitations for shareholders to vote on key topics
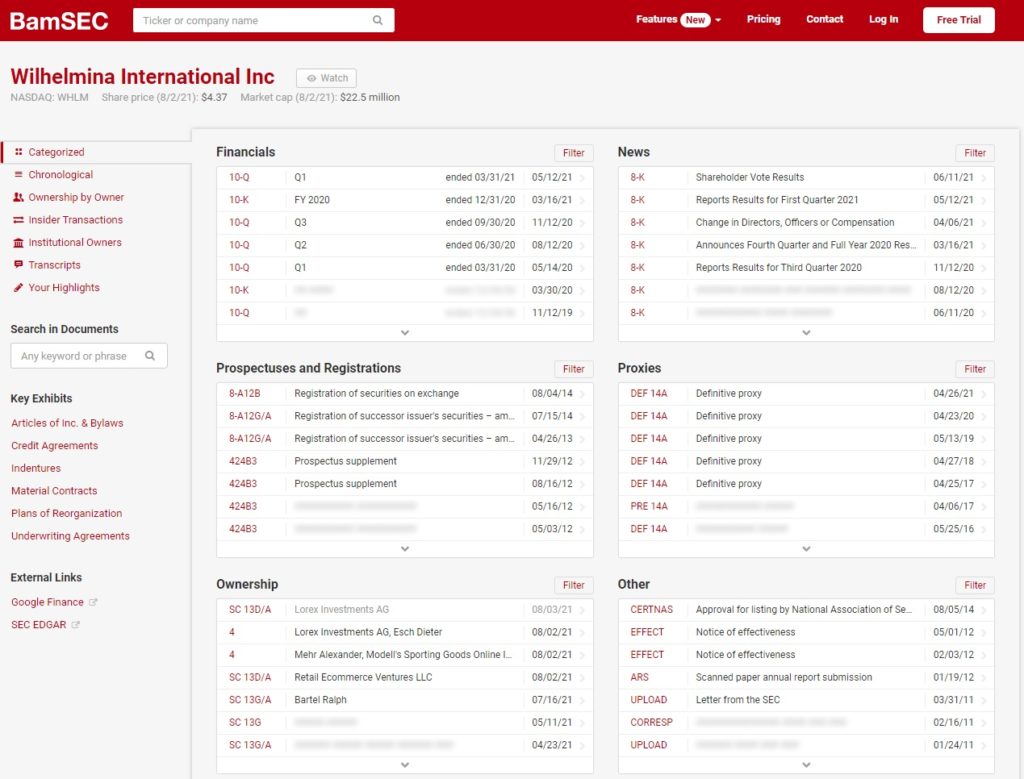
Breakdown of bamsec filings view

I’m sure if you’ve had any experience in the market, then you are all too familiar with how common it is to see these companies rob traders of their money through offerings.

The worst part is that, if you just spend a couple minutes researching on BamSEC, then you can identify if companies are in the position to drop an offering soon.

Real Life Example

For example, WHLM’s BamSEC shows that the last prospectus filed was way back in 2014.
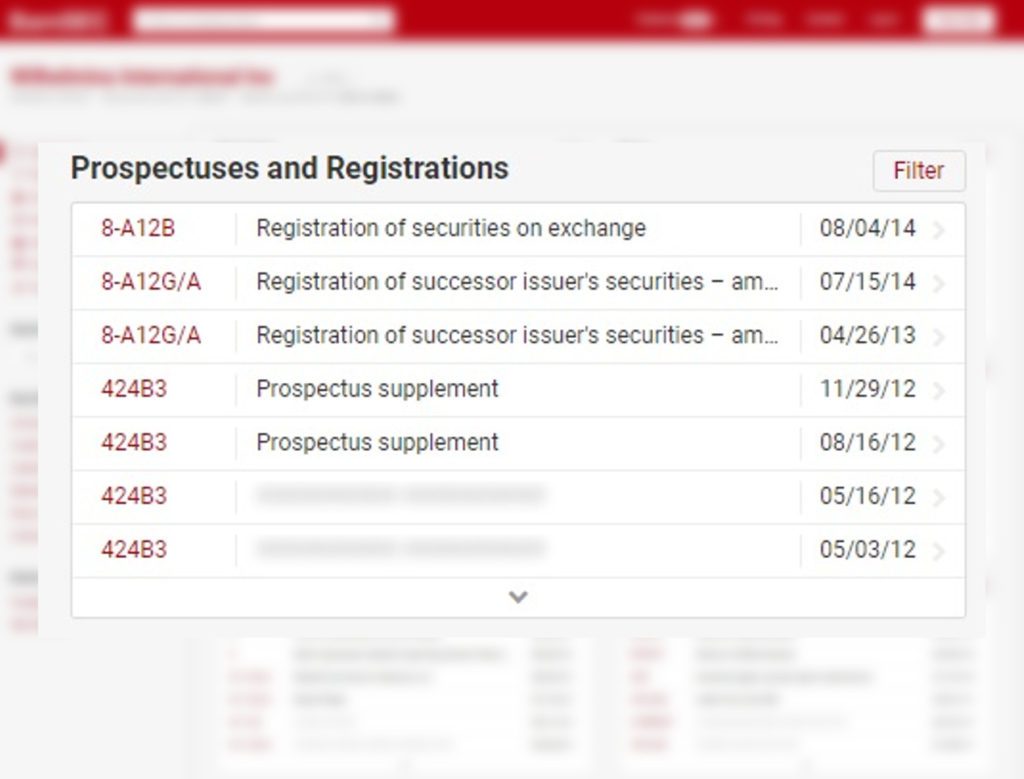
Identifying potential offerings in the free tool BamSEC

This means they have no active agreements to sell new shares either on the active market or to private investors at a discount. Now this doesn’t mean it’s impossible for the company to do an offering. However it does mean that it is very unlikely for it to happen on the day that you are trading the stock.

Now compare that BamSEC page to MINM’s BamSEC.
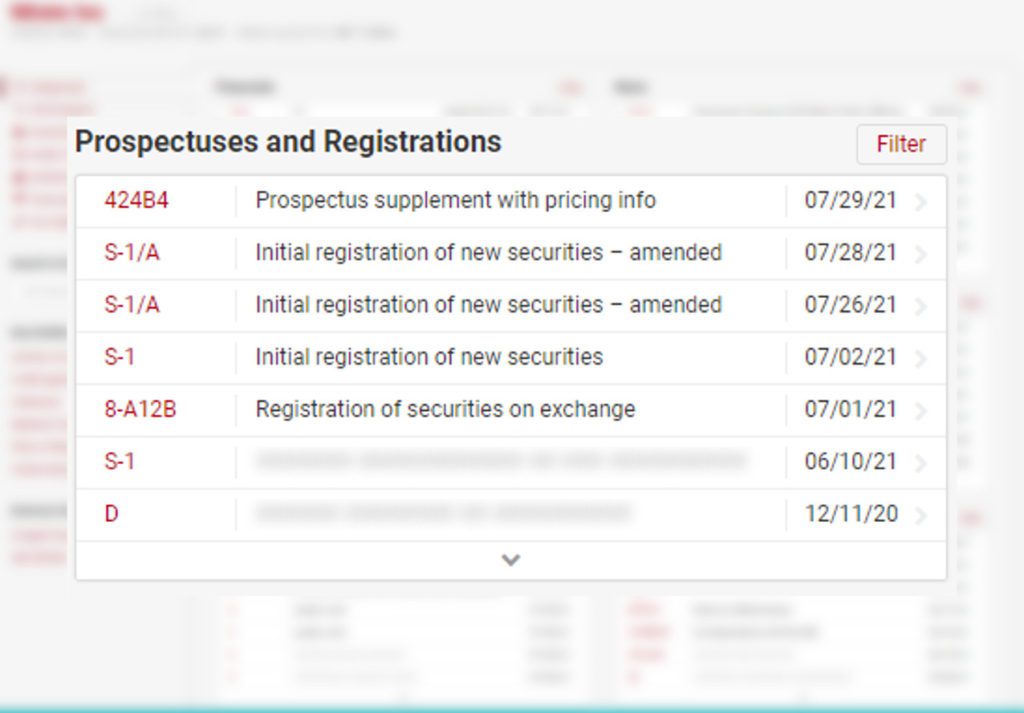
BamSEC filing page for MINM

Under Prospectuses and Registrations, you can see that there are many recent filings for registrations of new securities. This is known as dilution. Right away, we know that WHLM has less dilution than MINM. This info can heavily influence your decision to trade a stock. You may even save yourself from a nasty offering.

Free Trading Tools #3: StockCharts.com

What It Is

Stockcharts.com is a free website that traders can use to get an overview of any ticker symbol.
stockcharts.com front page

Type a ticker symbol into the search bar to view the daily chart and weekly chart of any stock.

Setting up your stockcharts.com display correctly

Take your analysis a step further by changing from a candlestick chart to a line chart. This is a secret that I use to find levels of support and resistance easier.
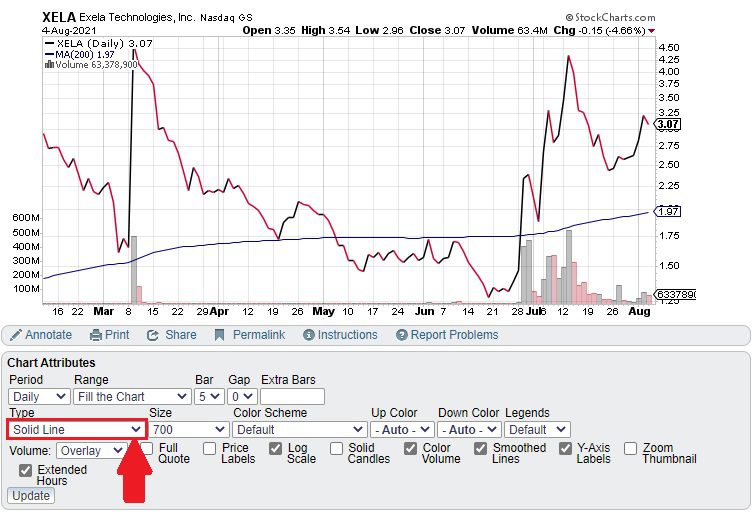
change chart type on stockcharts.com

You can also look at both the daily and weekly charts to gather more data.
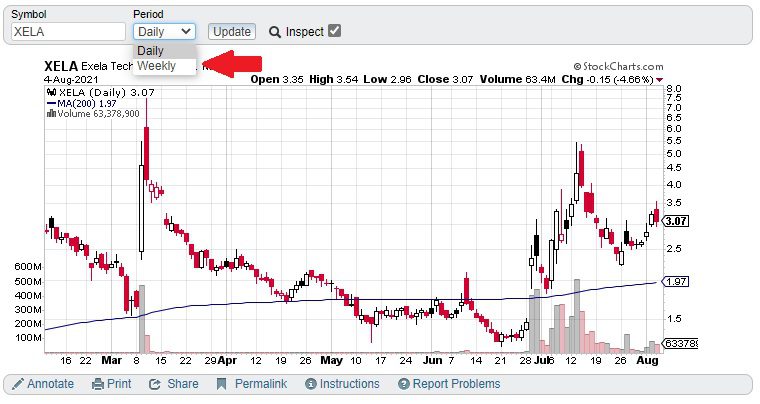
change between daily and weekly periods on stockcharts

If you want a crosshair to appear on the chart, just press the Inspect checkbox.

Adding indicators to stockcharts.com

Stockcharts.com also has the ability to add indicators and overlays to your charts.

Just understand that no matter how many indicators you have you cannot predict future market movements with complete certainty. Don’t end up with a chart that looks like you spilled spaghetti on it!

There are only 2 overlays that I have used consistently in my trading career:

  • 200 Simple Moving Average: Used both on the daily and weekly charts as another type of support or resistance
  • VWAP: Used as a level of intraday support or resistance and to judge if a stock is bullish or bearish. Note: I never buy solely because of VWAP!

Other than these two overlays, the only things I care about are price and volume.

Adding these indicators is very easy to do on stockcharts.com…

Just go below the chart into the overlay section. Then select Simple Moving Average and set its parameter to 200.

Then add another overlay and select VWAP.

Stockcharts - Overlays

Pretty neat right?

One cool thing about the Simple Moving Average is that it is based on the period of candles you select.

When looking at the daily chart we call it the “Daily 200 Moving Average”
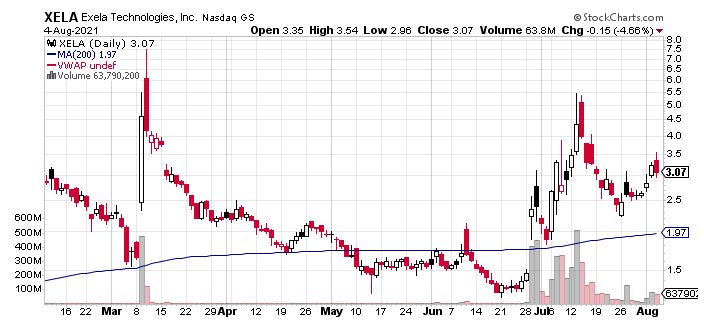
example of 200 simple moving average on stockcharts

On the weekly it’s considered the “Weekly 200 Moving Average”
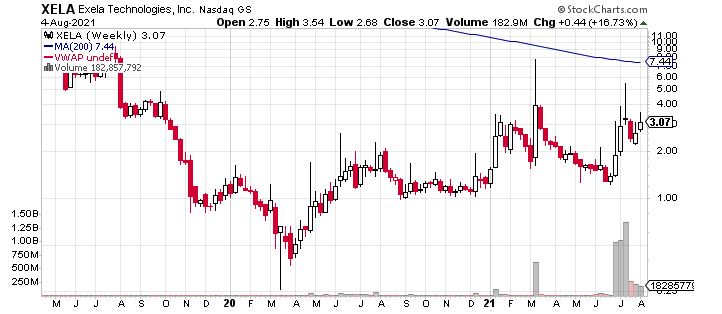
example of 200 simple moving average on stockcharts

These levels will be different since it is taking an average of the last 200 periods!

Overall, StockCharts.com is a very useful tool for traders. You can use it to practice finding levels of support and resistance on the daily and weekly charts.

Don’t have access to free data through ThinkOrSwim or WeBull? Stockcharts.com is a solid alternative for analyzing the chart.

Just keep in mind that Stockcharts.com has a delay. I would only use it to find levels of support and resistance, or for researching stocks in pre-market or post-market.

Free Trading Tools #4: Webull

What It Is

Webull Financial is a zero commission brokerage firm that has an easy-to-use application on the App Store and Google Play Store.

They also recently came out with a computer application which is pretty well made.

You can open an account with them for free and gain access to extremely useful free tools for trading.
Webull homepage

Webull Free Stock Scanner

One of the free trading tools that they offer is a scanner that you can use in premarket and market hours.

This sets apart from Finviz.com because the data feed is real time.

Remember, Finviz.com’s data is 15 minutes delayed!
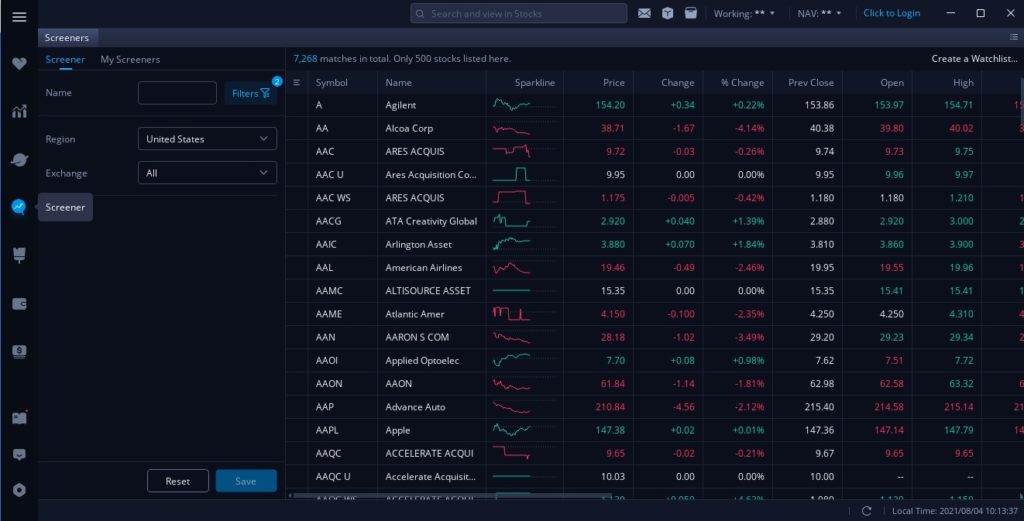
Overview of the free trading tools available in Webull

To add filters, simply press the “Filters” menu.

Select parameters in this drop down menu to add to your screener.
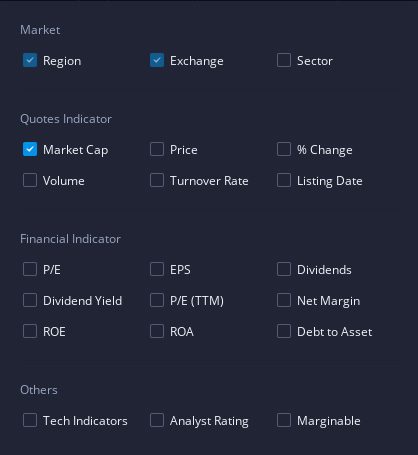
Webull free scanner filters


Webull Free Paper Trading

You can also paper trade for free on Webull. This is a must-have tool when starting out as a day trader. There is no point to risk your money in the beginning, especially when you haven’t proven yourself yet!
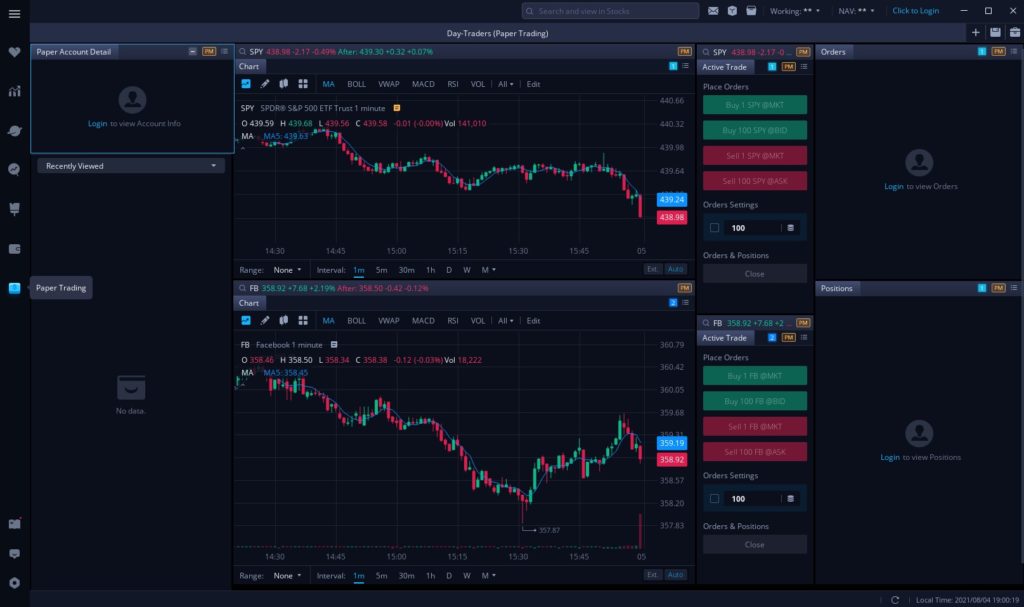
Webull free paper trading

I personally don’t recommend using Webull to paper trade. However, this is only true if you are able to use our next free tool, ThinkOrSwim.

I prefer ThinkOrSwim’s platform over Webull simply because it is the one I use every day. If you are going to be trading real money on ThinkOrSwim, you should use their Paper Trading module as well to become familiar with the layout.

Check out my WeBull Youtube video for a full breakdown of their desktop and mobile app.

Sign up with WeBull using my link and receive 2 free stocks worth anywhere from $100 to $1,000. That’s free money baby!

Free Trading Tools #5: ThinkOrswim Platform

What It Is

ThinkOrSwim is a trading platform by TDAmeritrade targeted towards active traders. Their primary customer base are US and Canadian citizens, however are available in a few other countries too. I have used this platform for the past 3 years and I cannot recommend it enough.

ThinkOrSwim - Home

It has basically all the free trading tools you will need in one package. Best of all, it is free to sign up. They also offer free commissions for all listed stock trades. Note that OTC and Options trades do have a commission of $5.95.

Some key features that ThinkOrSwim offers are:

  • Paper Trading
  • Market Scanning
  • “OnDemand” Historical Trading
  • Customizable Charts

Just to list a few.

ThinkOrSwim Free Paper Trading

ThinkOrSwim’s paper trading is awesome because it works exactly like their real trading platform. This means once you have proven your skills, you will be using the same exact layout so your execution stays consistent.

If you end up using Paper Trading, make sure to adjust your account size accordingly. The account is $100,000 by default so change it closer to what you will be using once you trade for real.

For example…

If you have $5,000 to trade with, make sure your paper account is also $5,000. You will avoid the big mistake of overtrading and using too much size by doing this.

To do this, simply go to “Activity and Positions” under the Monitor Tab. Then press the “Adjust Account” button. You can manually type in the amount desired next to “Set Account Cash To:”
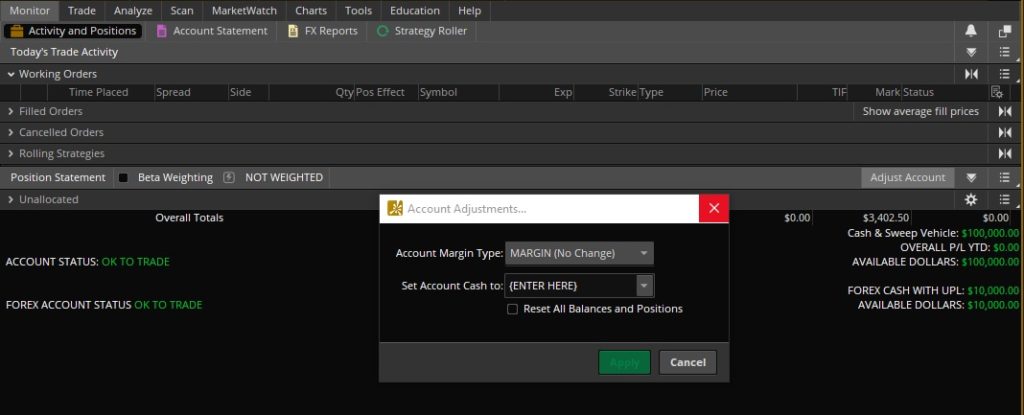
How to adjust account size in ThinkOrSwim paper money

Then hit “Apply” and you’re done!

Check out my YouTube video that breaks all the features down of ToS Paper Trading to learn more tips


ThinkOrSwim Free Market Scanning

Part of the free trading tools package that ThinkOrSwim offers is their scanners. When compared to Finviz’s scanners, it is lacking in a lot of filters that you can use. However a big bonus is that the results are real-time.

This means that you can use it during market hours and avoid the 15 minute delay that Finviz has.

In order to access the scanner, simply press the “Scan” tab and then “Stock Hacker”
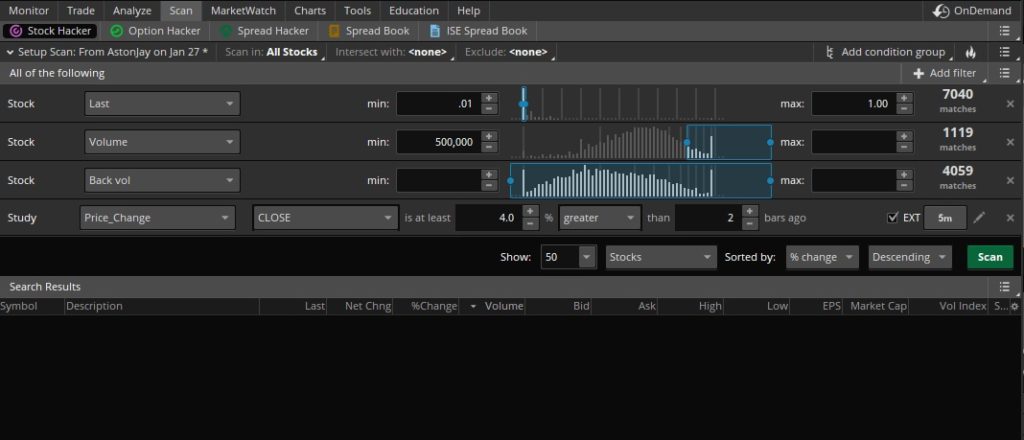
Overview of the ThinkOrSwim Stock Hacker Scanner

You can add filters by pressing the “+ Add filter” button. Most filters that you will be using are under the “Stock” selection. This will add a row with a drop down menu of a variety of filters. Then, depending on your selection, you add a “minimum” and “maximum” value to scan for.

For example, if I choose Volume and then put a minimum of 500,000 and maximum of 10,000,000…

Adding Filters to the free ThinkOrSwim scanner

This will return all stocks that fall within that volume range at that moment.
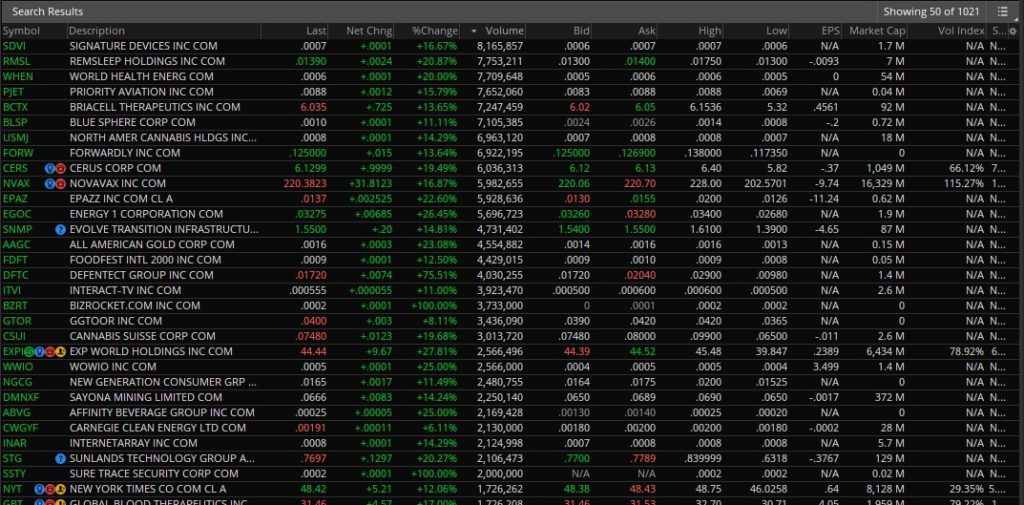
Scans Results from the Free Trading Tool ThinkOrSwim

You can enter as many filters as you want in order to specify your scan further.

Some great filters for small cap day traders are

  • Price
  • Volume
  • Market Cap
  • Percent Change

To name a couple…

ThinkOrSwim OnDemand Trading

OnDemand is a free trading tool provided by ThinkOrSwim that allows you to back-test your strategy. It lets you replay any trading day from the last several months and practice trading any stock that you choose.

You can run this tool 24/7 so it’s perfect for practicing your executions on the weekends or late at night.

Make sure that you don’t cheat yourself though! There is no sense to use OnDemand if you have already memorized a stock chart’s high and low of the day…

For example…

If you know a spike started at $5.00 and ran to $6.00…

Don’t simply buy at 4.99 and sell at 5.99. Obviously, this isn’t repeatable in real-world trading so you are working towards nothing.

Instead, do your best to ‘forget’ what happened on that trading day, and trade the price action as you see it.

Focus on the execution strategies that we teach in our free trading workshop and you’ll set yourself up for success.

In order to access “OnDemand” first make sure that you are on the “Live Trading” Portion of ThinkOrSwim. Then, simply press the “OnDemand” Button in the top right corner of the platform.

Enabling OnDemand in ThinkOrSwim

You can then change the date by pressing the calendar drop down. Select a date and then type in the ticker symbol of any stock and you are ready to trade in the past!

Free Trading Tools OnDemand Date

ThinkOrSwims Customizable Charts

Another reason why I highly recommend ThinkOrSwim is the fact that the charts are highly customizable.

You can change pretty much everything.

Background color, color of the candlesticks, color of your levels of support and resistance..

And so much more.

Here’s an example of what my ThinkOrSwim chart looks like:
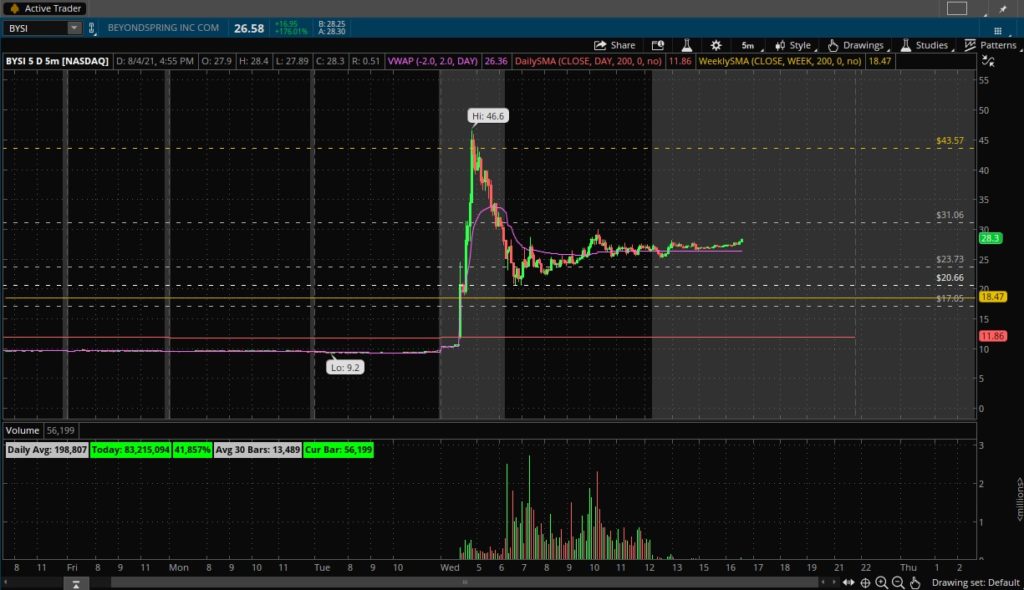
ThinkOrSwim - Chart

To change the overall settings on the chart, simply press the Cog Wheel along the top bar.

ThinkOrSwim - Chart Settings

The “Appearance” tab is where you’ll find a lot of the visual settings for the chart.

Here’s what mine look like:
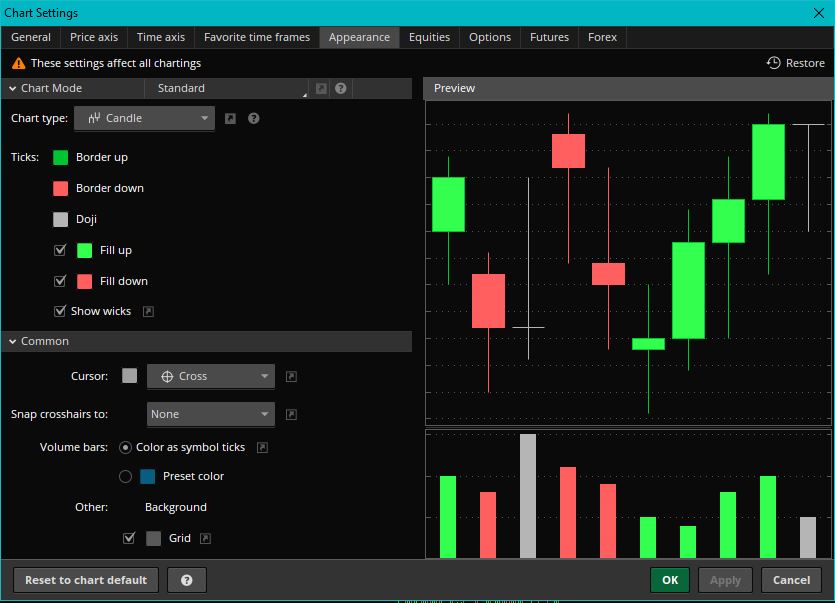
 

ThinkOrswim - Chart Appearance Settings

Of course, you don’t have to copy mine exactly. Make sure you style the chart to your own liking.

One pro-tip for using ThinkOrSwim charts is to press down on your mouse scroll wheel while hovering over the chart.

This will bring up your tools menu:
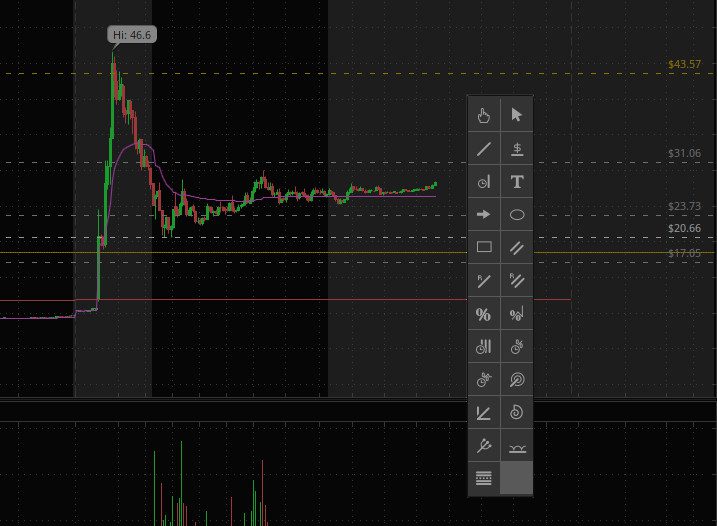
ThinkOrSwim - Tools menu

From here, you can draw pretty much everything you would need on a chart.

The main tools that I use on a daily basis are:

  • Pan: To drag and move the chart around.
  • Pointer: To select different drawings and move or customize them.
  • Trendline: To draw a line between two points (useful for measuring percentages)
  • Price Level: To draw horizontal support and resistance.
  • Rectangle: To box areas of the chart for teaching purposes.

Make sure to go into the settings of each tool you use after drawing them on the chart to become familiar with their options.

For example…

Whenever I draw a support or resistance level, I will edit it and color code it as needed:
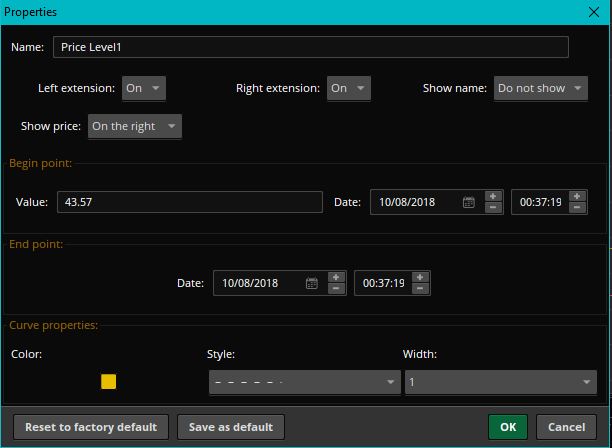
ThinkOrSwim - Level Settings

I use red for daily chart levels, yellow for weekly chart levels, and white for intraday levels of support and resistance.

As you can tell, ThinkOrSwim has a ton of features that we can’t cover in this post alone.

If you need more help with ToS, check out this video I created that breaks it down further.

Now It’s Your Turn

I hope this list has helped you in finding free trading tools to use.

Now I’d like to turn it over to you:

What’s the #1 tool from this list that you’ll start to use?

Are you going to use BamSEC to dive into filings easier? Or maybe you’ll start paper trading on ThinkOrSwim to practice your strategy.

Or maybe you have a question about one of these tools, or have another one to share with us.

Either way, let me know by leaving a comment below right now.


Open post

Watch List Building For Beginners

Building a watch list of tickers that fall within your trading strategy is an essential part of profitable trading. There are roughly over 15,000 stocks that trade on the US markets alone; far too many for you to be able to filter through each and every one. Attempting to do this would leave absolutely zero time for actual trading!

Thankfully the modern trader is spoiled with an abundance of stock scanners and screeners they can use which will help filter out the noise and find strong stocks.

Your daily watch list ideally starts out rather large in premarket, and then throughout the trading day it should evolve and wind down to only 2 or 3 stocks to focus on.

Step 1: Know Your Strategy

The first step in your watch list generation is to really understand what type of stocks you are looking for. Now, there really is no right or wrong answer for this; It really boils down to what strategy you trade. If you trade multiple strategies, its generally best to have separate scanners for each. This will keep things neat and simple to follow.

Do you primarily trade big chip stocks? Then your scanner settings would likely only include stocks over $10 per share. Only small caps? Then  your scanner settings should ignore all stocks over $10 per share. You can scan for hundreds of parameters like Float, Dollar volume, Percent Change to identify exactly what you are looking for.

Think about your strategy and what common parameters any stock would need to fit in order to fall within it. For example, let’s say that your strategy is to dip buy stocks that are extremely sold off. You have a particular interest in low float stocks breaking new 52 week lows, so you can use that to your advantage:

  • Strategy: Dip Buy All Time Lows with Volume
  • Trigger: Breaking 52 week lows
  • Float: Less than 25 million shares
  • Volume: Greater than 100,000

A scanner that had these parameters would immediately filter out thousands of stocks that do not fit your criteria.

This immediately prevents you from overtrading or trading stocks that are out of your criteria, which will immediately increase your profitability. It will also transform your process into a more process-orientated one, one which you can build a daily routine around.

Step 2: Using Scanners To Develop The Watch List

It’s important to note that not ALL stocks on your scanners will become trade setups.. they are just stocks with potential trades. It’s very important to further verify that the stock can become a

The scanner that I use daily is Scanz, read more about it here

Here is a breakdown of one of the main scanners that I use within Scanz:

  • Price : Between $0.10 and $10.00
  • Percent Change: +5%
  • Day’s Trades: 250
  • Float: < 35 million shares

This will essentially find any Small Cap Stock that is green on the day with some sort of catalyst. The percent change ensures its green on the day, and having more than 250 trades hints that it is somewhat liquid. Obviously, most of the stocks I trade have thousands of trades, but I don’t want to cast my net too small early in the day.Sign up for Scanz 14 Day Trial
If you don’t have Scanz or can’t afford it in your current trading budget, that’s totally fine. Most brokers nowadays like ThinkOrSwim and WeBull have built-in scanners that work pretty well. You can also find a free scanner on Finviz, although that one is very lacking in its features.

Depending on your strategy, you’ll want to either scan for stocks after market close, or before market open. I Start my morning at about 4:00am (7:00am EST) and have my scanners run continuously throughout the day.

This allows me to see stocks as they cross my scanner parameters, allowing me sufficient time to run the stock through the TradeBuddy Trading Checklist and plan a trade before it’s too late.

Having real-time scanners can give you a massive edge, whereas a scanner like Finviz only updates every time you refresh the page.

Step 3: Creating Your Watch List

This is where you decide whether or not any particular stock that shows up on your scanner is actually worthy of your attention.

Remember, a stock simply showing up on your scanner does NOT mean its time to buy. I purposefully cast my scanners ‘net’ very wide so that I can see a broad range of stocks; I understand that a ton of them simply wont be worthwhile. It only takes a few seconds for me to view the daily chart and the catalyst and come up with a decision to trade or not.

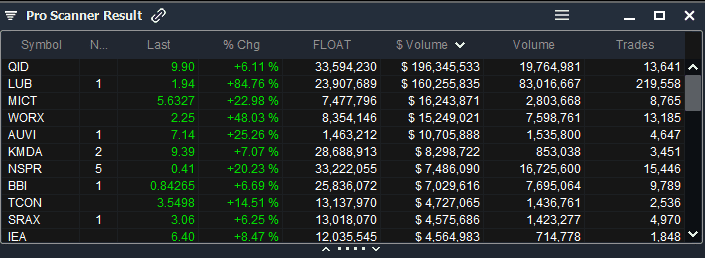
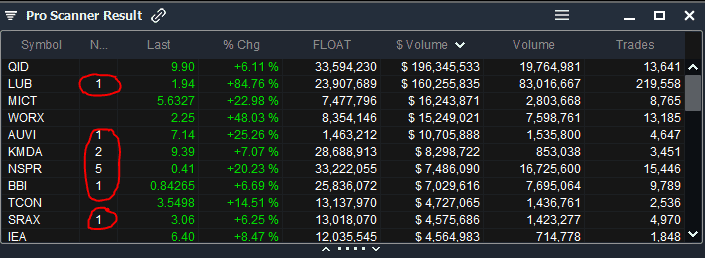
For my strategy, I simply look at each stock that has a news catalyst. In the above picture example, the stocks that I would look at first are LUB, AUVI, KMDA, NSPR, BBI, and SRAX.

The numbers next to the symbol represent amount of news releases today

By clicking on the # of news releases I can quickly view the news causing the stock to run. Then, if I am a fan of the news I will pull up the ticker and look at the Daily time frame. I then determine whether or not it fits my ‘A+ Setup’ and go from there. You can learn more about this strategy by signing up for the free trading workshop

From here, you would have ideally created a Trading Plan. This means you identified levels where you want to enter the stock, levels that you want to lock in profits, and the level that you will stop out for a loss at.

Having the trading plan ready BEFORE you take the trade is an absolutely integral part of trading.

Once you’ve analyzed each chart with news, you can decide whether or not you want to look at other stocks, depending on if you have enough plays for the day. This is where trader intuition and experience can really save you time; You’ll start to naturally figure out what stocks will not be in play based on their share structure, volume, and catalyst.

Step 4: Maintaining your Watch List

Once you reach this part in your daily routine, it should be very clear which stocks are in play based on your trading strategy. Now, your job is to simply have all of these stocks on your watch list, as long as their potential remains true.

Has a stock completed its move? Did it fail to do what you expected? It is your job to maintain the watch list appropriately. A watch list is only as good as the trader that maintains it!

At the end of the day, review your watch list again. If there are any stocks that are lasting on your watch list, you can choose to either move them to your long-term watchlist or have them ready on the following day’s watch.

Always make sure that your watch list is never too cluttered, and always take time to review the stocks on your list in order to ensure that they deserve your attention

Final Thoughts

Having a watch list is very important for any trader, day trader and swing traders alike. Using modern scanning tools allows you to focus on the stocks that truly matter.

With every trading process, its important that you follow a consistent routine to eliminate any possibility of variables ruining your edge. My watch list development follows a strict morning routine that I repeat day after day, and I recommend that you do something similar.

Be sure that you know what your trading strategy is and what you are looking for; from there its simply a matter of learning how to use the scanners to find what you need.

Need help finding your strategy, or simply want to copy our watch lists? Join TradeBuddy today via our 14 Day Trial
Open post

The Definitive Guide To Day Trading In 2020

The Definitive Guide To Day Trading In 2020

This is the ultimate guide to Day Trading in 2020.

Let me be clear about something:

This is NOT your average "Buy The Breakout" trading guide.

We will be covering how the big banks and institutions enter and exit trades.

If you want to make money trading, then you have to move with the big money.

You're going to see new strategies that are working great right now.

So if you're looking to improve your Day Trading this year, you'll love this new guide.

Contents

  • Day Trading Basics
  • Important Trading Terminology
  • Proper Stock Selection
  • Starting With Paper Trading
  • Trade Profitability Analytics
  • Optimize for the Entire Move
  • Master Your Trading

CHAPTER 1:

Day Trading Basics

Day Trading trading is a very misunderstood term.

Most people think you need to be taking hundreds of trades per day.

This is simply not the case.

Today, the best day traders only take a few trades a day, max.

Typically, day traders don't necessarily trade every day.

In many ways, we spend more time waiting than we do trading.

And in this chapter I'll cover everything you need to know about this important trading trend.

"What is Day Trading?"

Day Trading is the process of buying and selling stock within a single day, which helps you lock in consistent profits. Day traders require on volatility and volume to give them enough range to make the trade worthwhile. One big advantage of day trading is that you do not have to have your money in the market for a long period of time, which reduces your overall risk.

One thing to understand is that without the proper education, you are likely to lose.

In fact, we did a case study recently amongst 5,034 traders.

We found that:

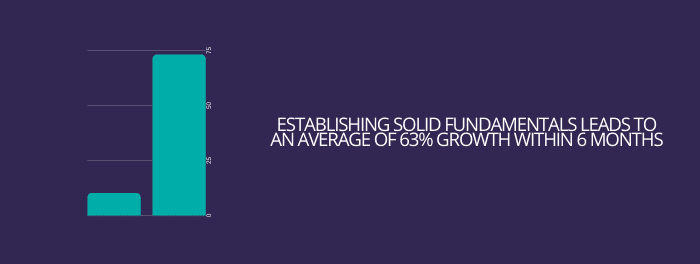
What you learn in the first 6 months greatly impacts your profitability.

And when comparing traders who invested into their education versus ones that didn't...

Successful Traders Invest in education

They had a 82% higher chance of becoming successful traders.

So, as you can see, this is not something that you can just 'jump right in to'.

With that being said... lets move on.

What Determines A Stocks Price?

Surprisingly, a ton of individuals have zero understanding of why stock prices move.

Its actually quite simple.

If you've taken an Economics class, you're probably familiar with supply and demand.

Not familiar with that concept?

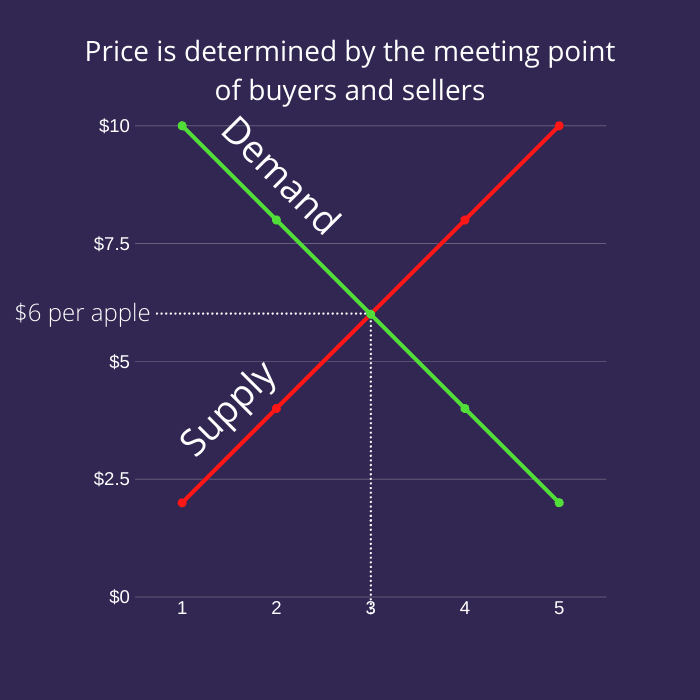
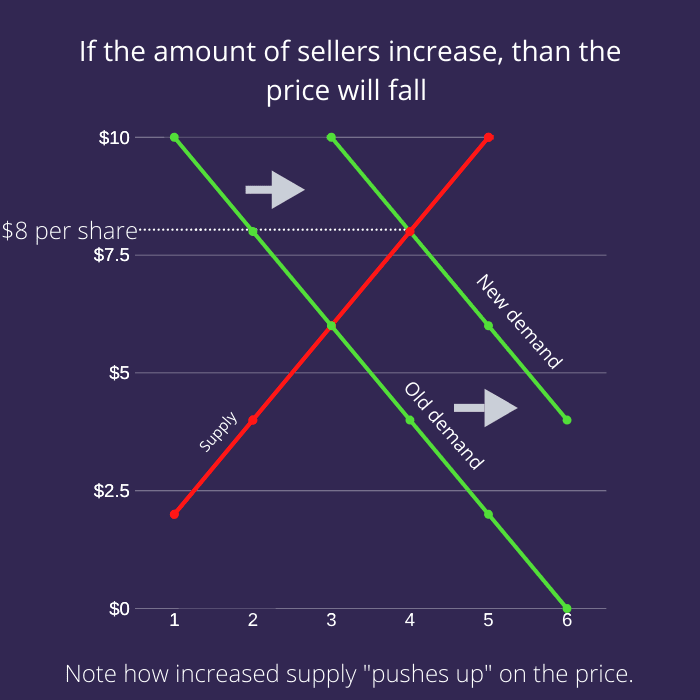
It basically means that price is determined by the meeting point of where suppliers want to sell an item and where buyers are willing to pay for an item.

For example..

Supply and demand

If you need an in-depth lesson on supply and demand, check out this article

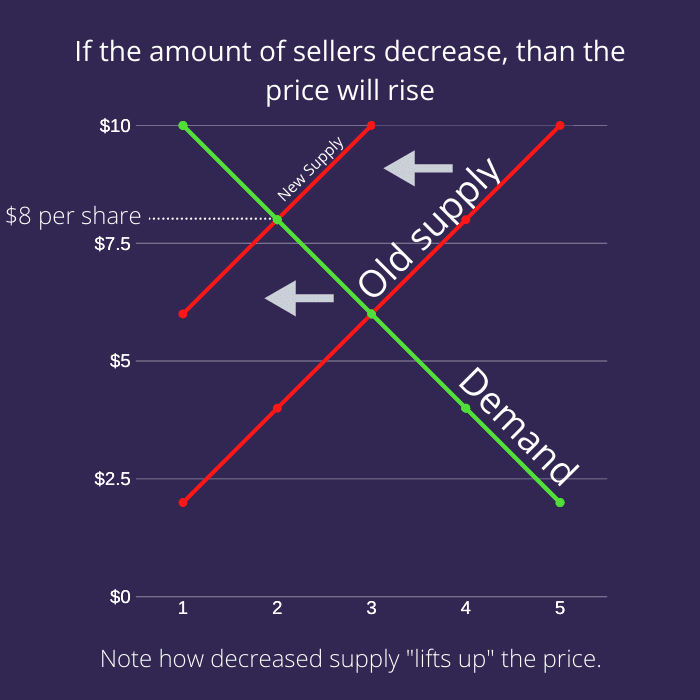
The graph above shows that buyers and sellers meet at the price point of $6

Meaning..

Sellers believe that their apples are worth $6 and are willing to sell.

And buyers believe that apples are worth $6 and are willing to buy.

For stocks, this works exactly the same.

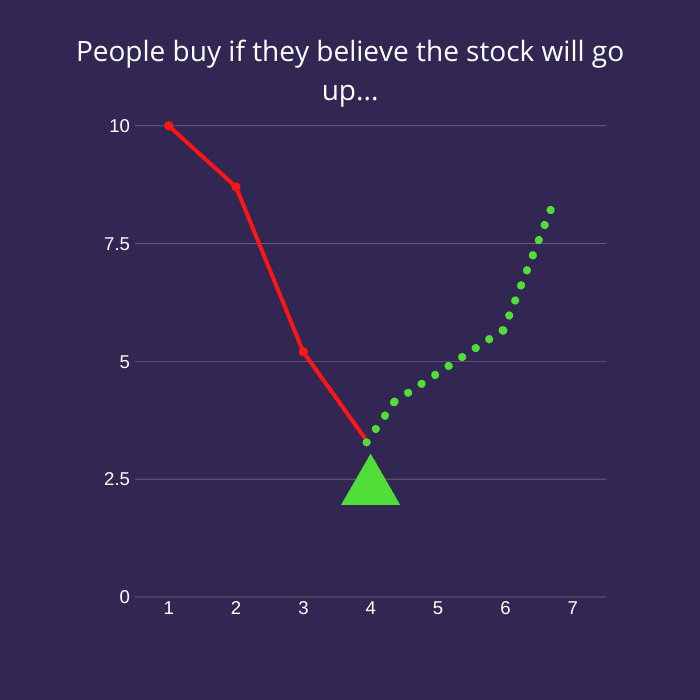
In general.. people will buy a stock if they believe the price will go up in the future....

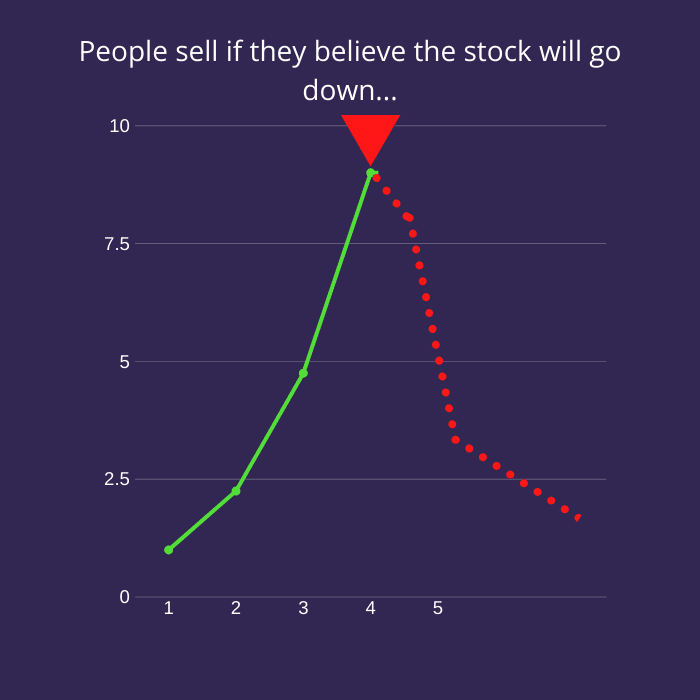
Sellers will sell a stock if they believe the price will go down in the future...

Why people sell stocks

Notice how this brings in an element of speculation?

This concept is very important, and is explained a lot further in my mentorship programs.

How does a Stocks Price Change??

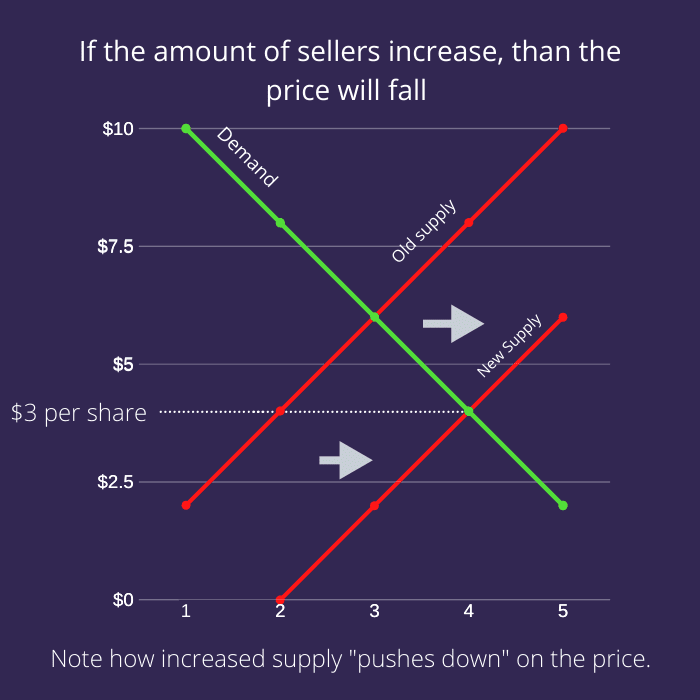
A stock's price changes when the supply and demand graph changes.

To put it simply,

If the supply increases (amount of sellers increase) than the price will drop.

Seller increase

If supply decreases, than the price will rise.

Likewise,

If the demand increases (amount of buyers increase) than the price will rise.

Demand increase

Likewise,

If the demand increases (amount of buyers increase) than the price will rise. And if it decreases, than the price will fall.

Why do people buy and sell stocks?

Fundamentally understanding the reasoning behind why someone is entering or exiting a trading position can MASSIVELY increase your edge in the market.

In the simplest sense, people will buy or sell a stock depending on how it affects their cash.

Now.. imagine this scenario

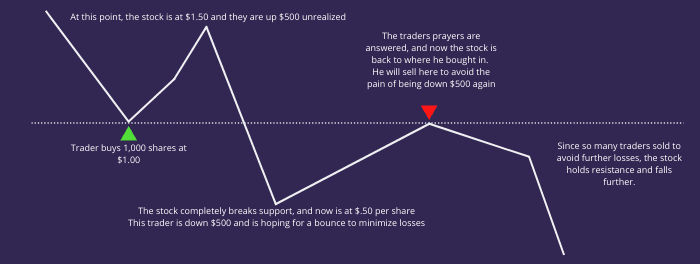
What if someone bought 1000 shares of a company at $1.00 each because he believes the price will raise to $1.50 and he can sell for a $500 profit.

However, he ended up being wrong and the stock dropped to $0.50 per share. Obviously, this individual would be panicking since he's down $500! This person obviously doesn't want to sell because "Its not a loss if you don't sell" so he holds and hopes for the price to bounce.

Eventually, the stock bounces back up to $1.00...

What do you think this person will be compelled to do?

Do you think he will hold and hope that he can turn it into a green trade?

Or will he sell for break-even, since he doesn't want to experience the emotional pain that he suffered when he was down $500?

Maybe he will hold and see if it can get above $1.00, but if it falls back below, he will sell so he doesn't have to suffer again.

In all of these scenarios, one thing remains certain. His decision is compelled by the price in which he invested into the stock.

This is the fundamental reasoning behind one of the most popular Technical Analysis rules:

"Previous resistance will hold as new support, and previous support will hold as new resistance."

Previous Support Holds As Resistance

This same thing happens when someone sells a stock because they believe it will not go any higher..

And then the stock goes higher anyways.

Since they don't want to miss out on the opportunity cost, they will be compelled to buy back in once the stock reaches the level they initially sold at.

Heres an illustration to make this simpler..

CHAPTER 2:

Proper Stock Selection

Proper stock selection is one of the most important parts of day trading.

You could do everything else right, but mess up this one step.


Today, the best day traders only take a few trades a day, max.

Typically, day traders don't necessarily trade every day.

In many ways, we spend more time waiting than we do trading.

And in this chapter I'll cover everything you need to know about this important trading trend.

What Types Of Stocks To Trade

There are many types of stocks to day trade.

You could choose from:

  • Big Chips
  • Index Funds
  • Futures
  • Small Caps
  • OTC

This guide will focus on Small Cap day trading.

The reason for this, is that small caps can generate MASSIVE returns compared to big chip companies.

For example:

The S&P 500 took an entire year to grow 40%

And that's if you timed the bounce perfectly.

<Insert SPY infographic>

Meanwhile, this small cap stock in the Coronavirus sector ran 100% in 15 minutes.

100% in FIFTEEN minutes!

You can see the extreme bonus of choosing small caps for your small day trading account.

Your gains will compound and your account will grow exponentially.


There are 3 important criteria to look for when choosing a stock to trade.

1. Catalyst.

We learned earlier that stocks will move higher if most traders buy because they believe it will return a higher price in the future...

The event that triggers these beliefs are called catalysts.

There are 3 main types of catalysts that we focus on as day traders:

  • News Catalysts
  • Technical Catalysts
  • Fundamental Catalysts

News Catalysts

News Catalysts are the most common. This occurs when there is news released that directly affects the company.

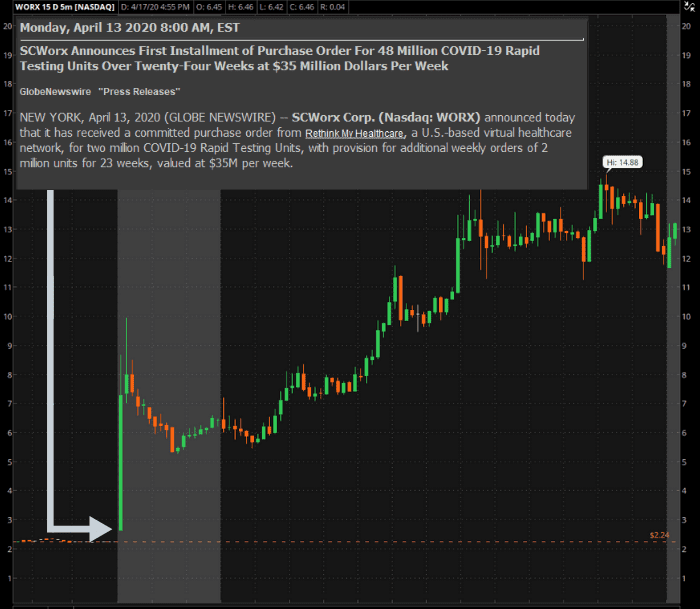
For example.. Imagine a company that is valued at $14 million releases news stating that they have acquired a new contract that will generate them $35 million per week.

Clearly, this company is now valued much higher than it was before they had this contract. People are likely to buy this stock since the news shows the company can grow a lot into its future.

This isn't a hypothetical scenario either, this actually happened in 2020.

Small Cap stock news catalyst

As you can see from the graphic above, the tiny company known as SCWorx Corp. ($WORX) released very positive news right in the midst of the Coronavirus epidemic. The world is in dire need of anti-body testing kits to figure out exactly who has had the virus in the past (meaning they're immune) to better understand when countries can start 'operating' again.

Before this news was released, SCWorx's market capitalization was only $14 million dollars...

In a single day, SCWorx went from $2.20s to a high of nearly $15 per share

That's an increase of over 563%!!

In general, the most important aspect to news is the reaction to the news.

Remember, the news itself is not what is causing the stock to move, its how traders and investors are reacting to the news.

A stock can have the greatest news release in world, but if people don't see it or don't care about it, the stock won't move or might even go lower. On the flip side, a stock can have very bad news, but if its not as bad as people expected, it has a chance to move higher.

Always consider what is happening with the bigger picture and always consider the other factors surrounding a stock before making a decision with your trade.

Technical Catalysts

Technical catalysts are also extremely common when it comes to small cap day trading. Technical catalysts relate to Technical Analysis, the practice of studying and interpreting data from the stocks' chart, price, and volume to determine what the stock is likely to do in the future.

If you've been studying trading at all, then i'm sure you're very familiar with terms like chart patterns, technical breakouts, and candlesticks.

The reason why things like breakouts and breakdowns happen is due to what we discussed earlier. People are forced to act in one way or another if they are losing opportunity cost.

People buy breakouts into a stock's all time highs because they don't want to feel the pain of missing a larger move.

They sell breakdowns into a stock's all time lows because they don't want to feel the pain of holding a massive loser.

These patterns being widely taught have led it to becoming a self-fulfilling prophecy, where the patterns work because most traders believe them to be true.

With this being said, no pattern can 100% predict the future movement of a stock.

I personally never buy or sell based on one chart pattern alone.

Instead, I use them to guide my thought process of what the stock is doing, and use them to judge the stock's bigger picture.

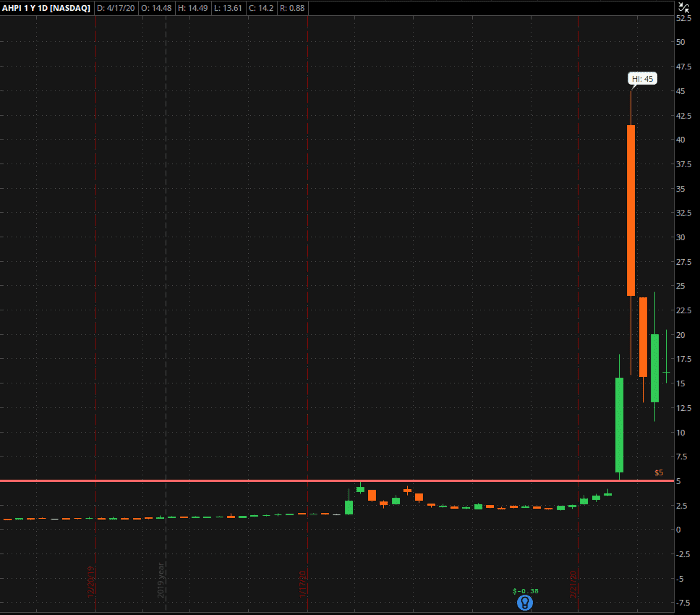
As shown by the horizontal line on the chart above, Allied Healthcare Products, Inc.  ($AHPI)  had a huge resistance level at $5.00 per share. Eventually, the stock was able to break out over $5.00 and caused the stock to go on a massive run all the way to $45.00 per share! That's gains of 800% on this single breakout.

This technical breakout was largely fueled by the fact that people did not want to miss out on its big breakout move, as well as sellers being trapped in a massive short squeeze. Retail traders and institutions alike kept selling AHPI as it broke out, but it continued to squeeze higher and emotionally forced those people to buy back in.

When it comes to technical catalysts, they have the highest odds of success when they happen on larger time frames, and are extremely obvious breakout levels.

For example...

A breakout on the 1 minute chart is completely insignificant, whereas a multi-month breakout into all time historical highs on the daily chart is extremely significant.

The more obvious the breakout is, the more likely it is for multiple people to see the same exact pattern and react impulsively to it.

Remember, the patterns are not what cause the breakouts, its the traders reacting to it. Volume with technical catalysts is extremely important as well.

Industry Catalysts

These types of catalysts are very similar to news catalysts, however instead of the news being direct at one singular stock, the news is direct towards a whole industry of companies. With industry catalysts, you can see many stocks from the same industry spiking on the same day, or dropping on the same day, depending on if the industry catalyst is positive or negative.

Industry catalysts are pretty common and typically end up creating some of the biggest penny stock spikes we've seen over the last 10 years.

For example, here is Longfin ($LFIN) which was a very new company that did an IPO with only a 5 million share float. In 2017 during the height of the Cryptocurrency Mania, they claimed that they had owned a subsidiary that owned a cryptocurrency platform. The stock went from around $10.00 per share to a high of $140.00 per share right around the same time that Bitcoin went from $10,000 to $20,000. The primary reason why $LFIN saw so much trading volume was simply because Bitcoin was running as well, and they shared the cryptocurrency industry (this is also called a Sympathy Play)

These industry catalysts happen all the time. Some examples of industries that have had massive catalysts are:

  • Cannabis
  • Military Industrial Complex
  • Coronavirus
  • Natural Resources

The Cannabis craze of 2018 spawned plenty of stocks that went on huge parabolic runs.

2. How Float Affects Small Cap Penny Stocks

Float is an extremely important component when it comes to a stock.

As you remember earlier, price is fundamentally driven by supply and demand.

Float simply refers to the amount of shares that are available to be publicly traded and is calculated from subtracting Restricted Shares from Outstanding Shares. Float is important because of how the supply and demand equation works.

We know that if demand is higher than price, the price of a stock will raise.

If a stock has a small float, then it is a lot easier for the amount demanded to surpass the available supply, meaning the stock can reach a much higher price.

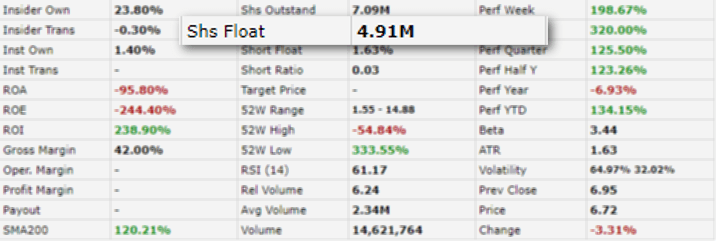
For example, $WORX from above has a 4.9 million share float (data displayed from www.finviz.com)

The small float means that it wouldn't take an outrageous amount of buying volume in order to create an extremely high demand when compared to how much supply there was.

In fact.. on the day that $WORX released their news, the stock had 96,182,928 shares traded!

This is 19 times more than the amount of available supply (also known as a 19 times float rotation)

Its no surprised that $WORX ran so high when broken down that way!

How Money Supply Affects Float

When considering float, you need to be sure that you're understanding the deeper fundamentals of what it is referencing to. One of my favorite pieces of data when it comes to analyzing stocks is Dollar Volume (also seen referenced as $ volume) The reason for this is because volume by itself can be very misleading on a wide range of stock prices.

If you wanted to purchase $1,000 worth of a $1/share stock, you'd get 1,000 shares. In contrast, if you wanted to purchase $1,000 worth of a $0.01 share stock, you'd get 100,000 shares!

If you focused on volume alone, you'd be led to believe that the 100,000 share order is a lot larger on the $0.01/share stock.

Dollar volume quite simply multiplies the day's volume by the day's VWAP (volume weighted average price) and gives you a very unique perspective on how much money is flowing through the stock. Having an understanding of how much hype there is (directly correlated with how much people are willing to spend) can give you a massive edge on any stock. In general, the side of the trade that has more money committed to it will be the side that wins (buyers vs sellers)

You can take this a step further by finding out the float's value. You can do this by multiplying the float by the day's VWAP which will give you an exact value for how much money the supply is worth. Now you can compare the money traded today against the stock's float value to gauge how quickly the demand is overtaking the supply.

For example, if a stock trades $5 million dollars before the market even opens at 9:30am (possible with premarket trading) and the float's value is only $10 million, then this is a good indication that there is higher than normal demand for the stock and it has a good chance to spike higher.

Big Floats vs. Small Floats\

To better understand the difference between a stock with a big float and one with a small float, lets take a look at 2 stocks that are polar opposites of each other.

First, we'll take a look at Apple, Inc. ($AAPL) Now im sure that this company needs no introduction. In fact, you're probably viewing this page from one of their devices.

Apple's stock has a float of

3. High Relative Volume

High Relative Volume is pretty simple.

First, lets understand what Average Daily Volume means...

Quite literally, its the average amount of volume the stock has received over (x) amount of days.

This is typically calculated by your broker software or scanner.

I use a script in ThinkOrSwim to show me the average daily volume of any stock I'm watching.

<Insert ToS script picture>

Average daily volume is important for a few reasons..

Lower Average Daily Volume = Easier For Stock To Run

If there is less average volume, this means there is not a lot of previous traders in the stock who will be ready to sell when the stock spikes.

Since we are day traders and want to profit on huge volatility, we need stocks that have huge range.

This means picking stocks that have no resistance.

You can find resistance on the daily chart as well.

One tool I like to use is the Volume Profile.

This combined with basic technical analysis will give you support and resistance levels.


CHAPTER 2:

Trading Terminology

Proper stock selection is one of the most important parts of day trading.

You could do everything else right, but mess up this one step.


Today, the best day traders only take a few trades a day, max.

Typically, day traders don't necessarily trade every day.

In many ways, we spend more time waiting than we do trading.

And in this chapter I'll cover everything you need to know about this important trading trend.

Useful Trading Terminology

There is a ton of terminology when it comes to trading.

We could spend an entire class focused purely on all of the different trading terms.

Theres fundamental analysis terms, technical analysis terms, brokerage terms, and so much more.

To save you time, we are only going to focus on the most important terms in this guide.

For a full terminology guide, visit our Day Trading Terminology section.

Lets get started.

Shares vs. Stocks: What's the Difference?

The difference between shares and stocks has been pretty blurred over the years.

Generally, both represent pieces of ownership in a public company.

The difference between the two words depends on the context of which you're using them.

For example:

You could ask, "How many shares do you have of this company?"

Or say, "What stocks do you own?"

What is trading volume?

In the stock market, trading volume refers to how many shares of a stock are being traded in a given time period. This can be defined as a quantitative value (how many shares have been traded today) or as a qualitative value (does the stock have trading volume) For traders, volume is important because it implies volatility. If a stock has trading volume, it means that money is flowing through it.

Float: A Quick Definition

Float is one of the most important concepts for day traders to understand.

It refers to the amount of shares that are available within the supply pool

Successful Traders Infographic
Open post

WeBull Review 2020 | Best Free Broker?

Webull Review 2020

In this review we will cover the pros and cons of the Webull Broker.

We will look into its tools and features for day trading as well.

As a bonus, we will compare this broker to others such as Robinhood.

Lets jump right in.

Zero Commissions Saves You Money

As stated above, Webull offers commission-free trading to over 5,500 U.S Stocks and ETFs with zero charges to open or manage an account. At this time, Webull does not offer Options Trading, however is working on getting it implemented and should be a feature that will be available sometime in early 2020. There are zero fees to access real-time U.S market data, however you have to pay a subscription-based fee in order to access Level 2 data. International markets also require a subscription-based fee that can be chosen through the app.

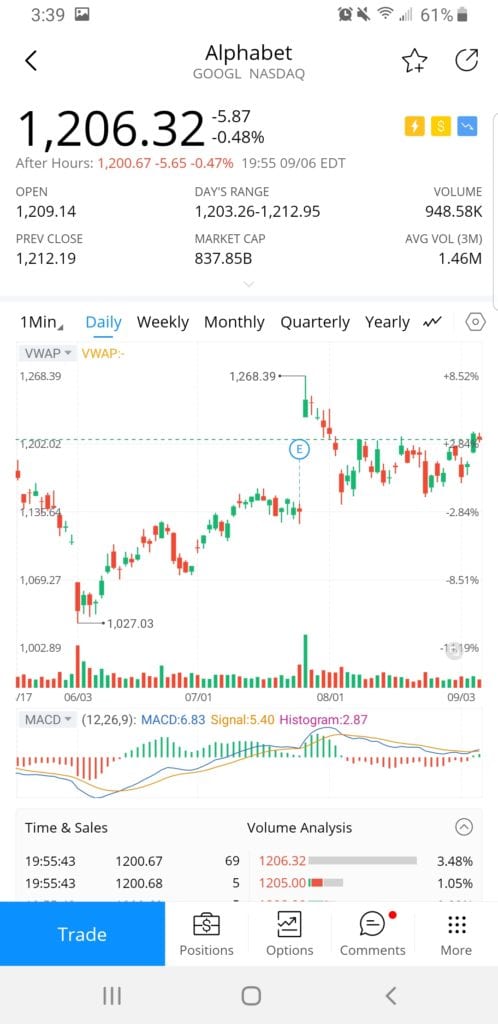
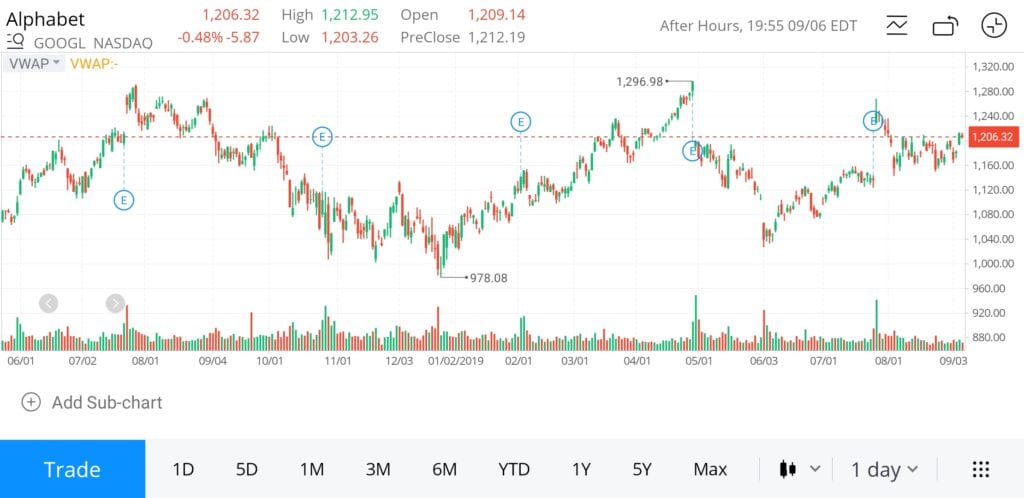
Webull stock chart review

Charts and Technical Analysis To Place Better Trades

The real-time and very user-friendly charts can be infinitely customizable depending on your trading style.

Options range from candlestick, bar and line charts.

Time frames can be set to:

  • 1-minute
  • 5-minute
  • 60-minute

You can even going up to daily, weekly, and monthly time charts.

Data goes back over a five year period and there is a very neat feature where you can replay the price action from any time during the past 30 days,

In addition, you can replay historical price action.

This can be done for any trading within the past 30 days.

This is great to study how a specific stock traded in real-time.

In addition, many indicators are offered by Webull.

For example:

  • Moving averages
  • VWAP
  • Bollinger bands
  • MACD
  • RSI
  • and so much more.

You’ll also get charting tools to draw right on the chart.

Tools & Analytics to find better stocks

If you are a value investor or a swing trader who focuses on the fundamentals of a company, Webull is your dream come true.

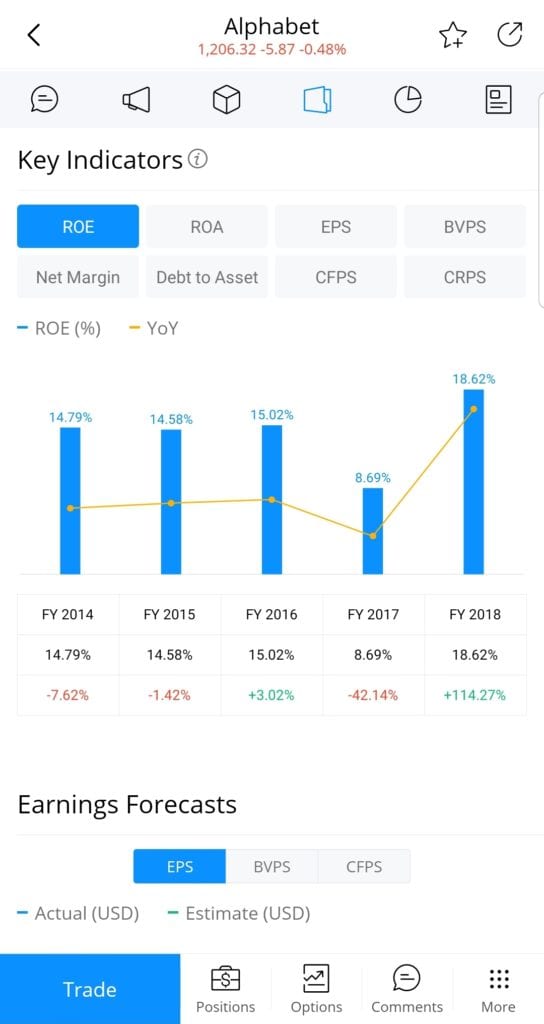
Some powerful analytical tools include:

  • Live News streams
  • Press release and filings
  • Historical EPS and revenue data
  • Insider holding statistics
  • Analyst recommendations

The graphs and charts provided with the fundamentals make the data easy to digest and allow you to quickly make your decision on whether or not the stock is a strong buy.

You are able to dive deep into the companies profile and operations, catalysts, and overall performance to gauge exactly what is causing the stocks price to fluctuate. As a bonus, you are able to save specific articles for future reference and even comment on certain stocks.

Webull Analytical tools

Watch List and Price Alerts allow you to never miss a trade


You are able to put together multiple watch lists in order to effectively track any sector or specific strategy that you wish. This is unlike other brokerages that only allow one basic watch list.

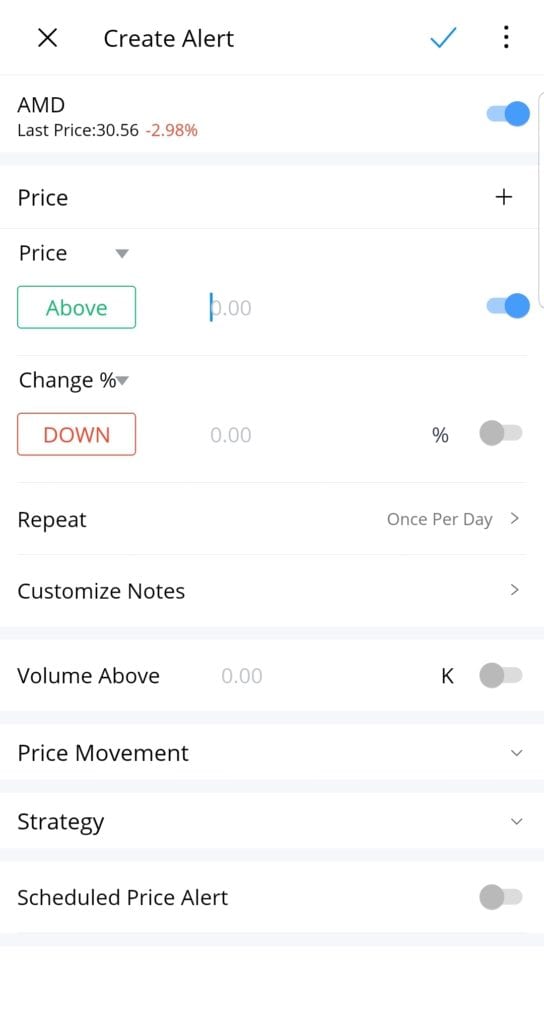
Additionally, Webull has what are called ‘Smart Alerts’ that will notify you via push notification, SMS, or e-mail when one of your alerts have been triggered. These alerts will notify you when a stock has passed a certain price level or indicator that you set.

Webull alerts

Paper Trading that helps you practice

One HUGE advantage that Webull has over the other free-commission brokers is the ability to paper trade right on their platform. It simply doesn’t make sense to jump in with real capital right away if you have zero clue what to do and if your strategy is consistently profitable.

Just like a doctor first practices on simulations and models of the human body, a trader should always first practice in a simulated setting so they do not risk real cash. While their paper trading is slightly lacking in some features, it is still a huge plus that they include paper trading in the platform. I am sure that they will implement limit orders as time goes on, so this won’t be an issue for too long.

Get a Free Stock worth up to $1,000 When You Open a Webull Account

Custom Stock Scanners

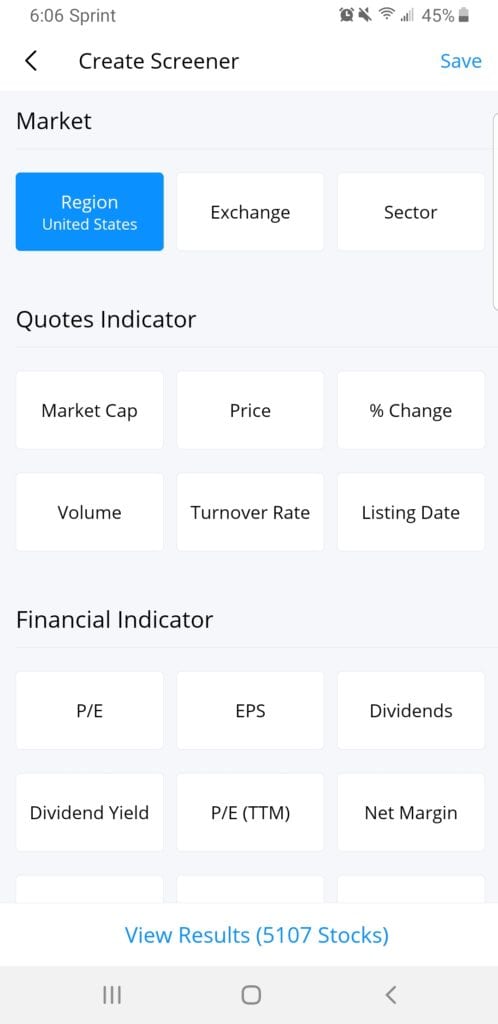
This is one tool that vastly sets Webull apart from other free-commission brokers like Robinhood. Within Webull, you are able to scan for stocks based on a specific criteria that you set. You are able to filter based on financials like P/E, EPS, Dividend Yield, ROA and others. You can also filter by technical indicators like MACD Golden Cross, RSI24 Oversold, MA 5 Cross Over 10, as well as basic quote scans like market cap, price, % change, and volume. This allows you to quickly and effectively identify stocks that fit your exact strategy and saves you a ton of time.

Webull scanner

Webull Margin Accounts, Leverage, and Short Selling

Webull allows short-selling through their margin accounts and also offers up to 4x intra-day margin and 2x overnight margin.

Net account balances must remain above $2,000 in order to avoid a margin call. If your balance drops below $2,00 while in a short position, the broker will automatically send a market BUY order and liquidate your position. Be sure to have a padding of account balance if you want to short so you don’t get accidently liquidated!

Webull’s Customer Service smashes the competition

For being a free commission broker, the amount of customer service options that Webull offers is pretty amazing. They have support agents available via live chat, phone, and email. The wait time is very minimal nd the agents are knowledgeable enough to handle any question that you throw at them. This is very important during trading hours in case you are having an issue with your orders and are ‘stuck’ in a trade!

You never want to have slow service when money is on the line, and I applaud Webull for keeping up good customer support standards.

Is Webull Better Than Robinhood?

With Robinhood being the most popular free-commission broker that is currently available, its not surprise that it is the #1 broker that Webull is compared to. Yes, they do both offer free commissions, but the similarities basically end there. The amount of functionality packed into the Webull app, as well as having a fully functional desktop app, sets it far ahead of Robinhood in my opinion. Their customer support is much quicker and you can simply do more with the Webull app, while still benefitting from free commissions.

Having more tools at your disposal is a big bonus.

For example, Webull has these features that Robinhood doesn’t.

  • Better charts
  • Custom scanners
  • Custom Trade alerts
  • In-depth market research

Webull also allows free options trading. This means there is ZERO reason to choose Robinhood over Webull.

Final Thoughts on Webull

Pros:

  • Zero Commissions For Trading
  • Free Paper Trading
  • Desktop & Mobile App
  • Fast Customer Service
  • Very Customizable

Cons:

  • Level 2 Costs an Additional Fee
  • Desktop App is lacking in customizability
  • Paper trading has limited features

Overall, Webull is a very powerful broker to use if you are a new trader looking to jump into trading.

You will maximize your profits with zero commissions.

Active day traders will save a lot of money by switching to Webull.

I would definitely recommend Webull as the #1 broker to use if you’re looking to jump into trading!

Sign Up For Webull Today and Get a FREE STOCK worth up to $1,000

Which feature are you going to take advantage of the most when you sign up for Webull? Will it be the paper trading, their custom scanners, or their powerful charting software? let me know in the comments below!

Open post

Top 5 Trading Rules You Need To Live By

Trading is inherently dangerous. Everyone knows that. We know that 90% of people who start to trade stocks eventually fail within the first year and most of their losses can be simply attributed to the fact that they didn’t follow any rules. They acted like gunsligners; randomly picking stocks with no systematic approach and hoping for the best.

If you want to gamble, go to Vegas. You’ll have a lot more fun and most likely lose a lot less than if you started trading.

However

If you want to trade PROPERLY and not blow up your account in the first year, then continue reading this article.

Sign up for our FREE trading course

Watch the video below the top 5 rules for trading!


#1: Cut Your Losses Quickly

This rule cannot be overstated enough. I know it seems simple, but its so true: If everyone was simply able to cut their losses quickly, NO ONE would blow up their accounts, and no one would be bagholders. Unfortunately, its an issue that plagues so many new traders. If you cut the loss quickly, yes you lose a tiny amount of money, but small losses are impossible to avoid. As long as your trade was based on a consistent system, then the small loss is just a tiny step back in the long-term.

If you allow a small loss to turn into a huge one, it not only hurts your pocket book, but hurts your soul much more.

You will lose confidence, be upset with yourself, and potentially attempt to revenge trade to make the profits back (which can lead to disaster). Avoid all of this by simply having a risk level in place, and most importantly utilize a hard stop whenever you can. I don’t care if market makers or brokers can ‘see’ my stop; if they decide to take me out then so be it. If this starts to happen on a consistent basis, then that means I simply am entering too early, and look to enter more at the true support.

#2: Trust The Chart!

Never give too much dependence on some sort of indicator or study on the chart.  The hard truth is that every single indicator is calculated from the chart itself. That means, whatever information you’re receiving from the indicator can be also seen just by reading simple price action.

Everyone sees the chart, not everyone sees or respects your indicator.

Have trust in support and resistance, but also understand price action and the trend. Build your knowledge on understanding trends, reversal signals, and signs of front side VS back side. Always base your entries and exits on support and resistance.

Keep this in mind; most (if not all) profitable traders I know mainly rely on price and volume, and maybe have 1 or 2 indicators to confirm what they already know from the chart.

#3: Have A Pre-Trading Checklist

So many new traders have an issue with overtrading, chasing, having FOMO, and overall making terrible entries. The absolute best way to avoid overtrading is to have a pre-trading checklist and STICK TO IT. I offer my pre-trading checklist as a part of my free course here

In order to have a proper trading checklist, you of course need to start identifying and pinpointing exactly what trading strategy you want to go with. Then, you need to narrow the variables and ‘signals’ that you must have checked off before entering the trade.

For example, you must ask yourself questions like:

  • Is this stock within my ideal price range?
  • Does this stock have a good float value?
  • Does this stock have a solid catalyst that will bring volume?

Asking yourself simple questions like this before you give into the adrenaline rush of trading will allow you to proceed with a clear mind and potentially avoid entering impulsively. Remember, stocks ALWAYS pull back, and if you miss this one trade, it won’t be the end of the world. It’s so much better to wait for the ideal moment to position yourself; for your pocketbook and your soul.

#4: Make A Plan Prior To Entering

This rule goes hand-in-hand with having a pre-trading checklist. Just like you should first verify that the trade is actually worth taking, you need to also figure out EXACTLY what price you want to enter at, what price you want to cut the loss (otherwise known as risk level) and what price you want to start locking in profits. YOU MUST DO THIS BEFORE YOU ENTER THE TRADE. If you wait until actually entering, you will be emotionally bias and more likely to act greedy, and not cut losses fast. ALWAYS make a plan prior to entering your trade!

It goes without saying that your trading plan should be based on the basic levels of support and resistance that the chart shows. It doesn’t make sense to take profits if the stock is still in a bullish uptrend and is holding support levels. Likewise, it doesn’t make sense to continue holding if the stock is showing signs of back-side and is breaking critical levels of support.

#5: Have A Trading Journal!

This is quite honestly THE MOST IMPORANT rule to follow. Honestly, I wouldn’t even call it a rule, because you shouldn’t even have the option to break it. This is a necessity of trading.

In order to be a consistent trader, you must first be using a consistent system of trading. Using the same strategy, trading the same stocks, and having the same mindset while trading. Then, you need to track the progress of all of these trades over time, and see your profitability numbers. Average % win, average % loss, win rate, and so on.

Do you REALLY think that you’ll be able to do this from memory?

OF COURSE NOT.

Every single trade MUST be tracked and then reflected on at a later date.

If you don’t do this, I promise you that you won’t be consistent. Every single professional trader that I have asked has a trading journal, and if you want to join their ranks, you will need one as well. Just like my trading checklist, I also provide a template for a trading journal to use in Excel as a part of my free training course. Check it out, learn how to be a profitable trader, and gain access to the top tools required in order to do so all for free.

What trading rules do you live by? Let me know in the comments below!


Open post

What Is VWAP & How To Use When Trading

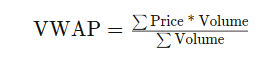
Volume Weighted Average Price (VWAP): A benchmark indicator that gives the average price a security has traded at throughout the day, based on both volume and price.

VWAP is a very powerful indicator, and is in fact one of the only indicators that I use on my charts when I trade. If used correctly, it can provide deep insight into the current structure of ‘the move’ and allow you to effectively maximize your profit potential and at the same time, help you understand when it is time to jump ship and exit the trade. Keep in mind that the content on this page is meant for small cap day trading, specifically low float stocks. In the video below, I will explain exactly what the VWAP indicator is and how it’s calculated, and how to use vwap when day trading small cap penny stocks.
Sign up for our FREE trading course

Watch the video below for an in-depth explanation of VWAP!


How VWAP Looks:

The pink/purple line  on the chart above is the VWAP indicator when displayed on E-TRADE PRO charts


Key Takeaways

  • The Volume Weighted Average Price (VWAP) appears ONLY on intraday charts (1 min, 5 min, 15 min, etc.) and will NOT show up on daily charts.
    • Because of this, VWAP calculations are reset at every market open
  • In general, if the stock is above VWAP, it is considered bullish, if it is below vwap, it is considered bearish
  • Don’t rely on VWAP exclusively to determine price action and trend, be sure to utilize basic support and resistance principles as well


VWAP formula

Using VWAP to read price action


One important thing to understand about VWAP is that it resets at every market open. This means that, in general, the volume and price action during the morning will dictate which way VWAP will go. (Think of it as the morning volume is weighted more heavily since it is the starting vol for the calculation)

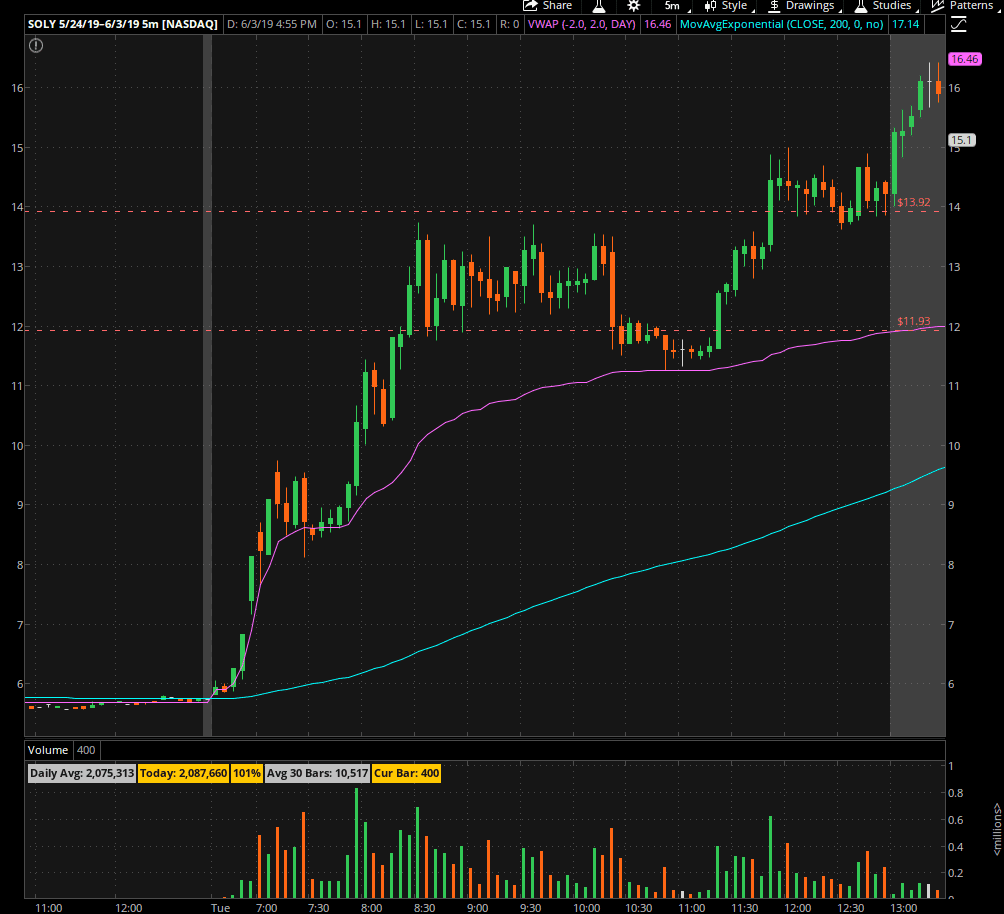
For example, take a look at SOLY on the right. The purple/pink line is the VWAP, and volume is listed at the bottom. In the morning, there was extremely high volume followed by a huge surge in price. Within the first hour or so, the stock spiked from $6 to around $14 on large volume. You can see that because of this massive morning volume, the VWAP was able to stay close to the price and give it support on the way up.

Another thing to note about this chart is how VWAP acted as support at 2 critical points on SOLY’s move. This is largely caused by institutional banks and mutual funds choosing to enter at VWAP since it is considered ‘the point of most liquidity’

As noted before, in general if the stock is above VWAP it is considered bullish, and VWAP can be used as a sort of support level. When the stock is underneath VWAP, it can be considered a resistance level.

Another thing that you can use to your advantage is understanding price action in relation to VWAP. I explain this a lot more in depth with TradeBuddy University students (find out more here…) but, in general, the first big push over VWAP will almost always have a dip down to VWAP. This means that you do NOT need to sell at the first signs of a pullback, because the stock can very easily pull back to VWAP and then break higher. It is only time to sell once the stock puts in a LOWER HIGH after bouncing vwap, and then cracks the VWAP line.


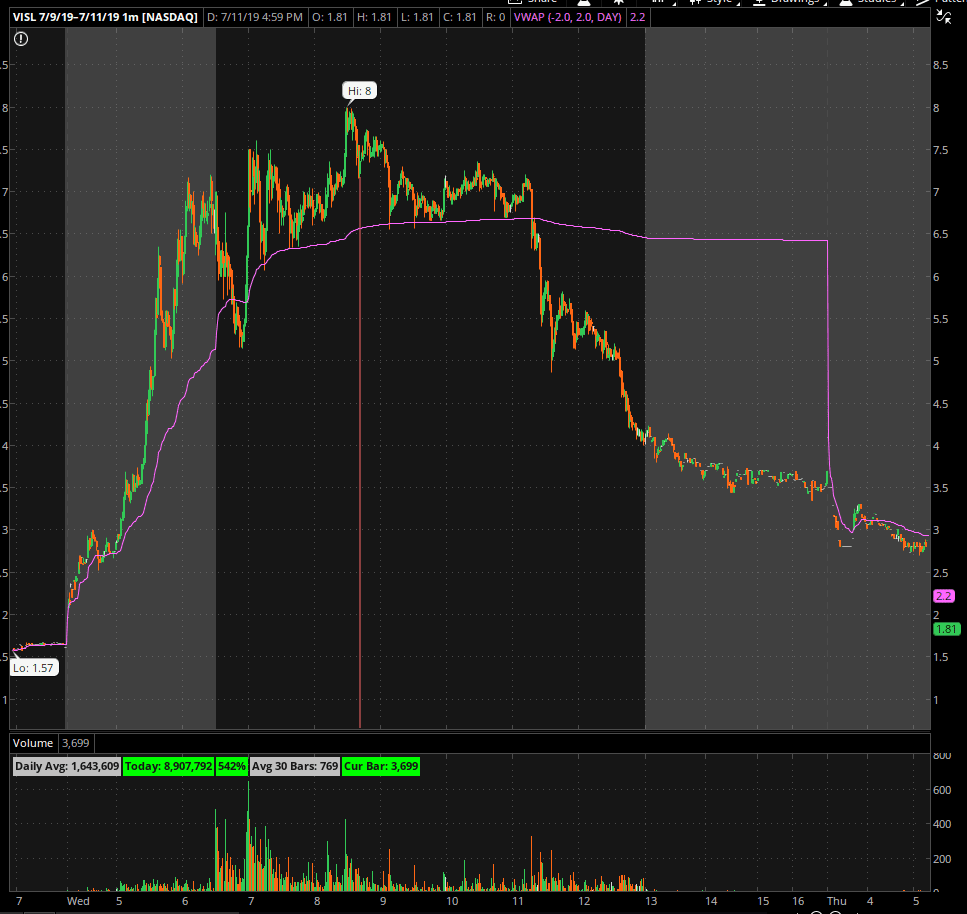
VISL is another good example of how VWAP can be considered support and resistance, and can help you identify the ‘backside’ of a move; when the stock is truly done for.

Notice that after it hit highs of $8.00 and started to make a descending triangle against VWAP. If I saw this happening live, I would prepare to get stopped out if it breaks VWAP, because that would be a bearish downtrend move. Once it finally broke the VWAP on significant volume, it tanked a ton. Usually, whenever we see a crack from front-side to back-side, we see a bounce that rejects VWAP (thus confirming the new trend) but in some cases, when the sell-off is simply too strong, there will not be a bounce.


I hope this helps you understand a bit more about price action in relation to VWAP and how you can use it to your advantage when trading. Remember, VWAP can only be used on intraday time frames, so don’t freak out if it is not showing up on your daily chart.

Want to learn more about trading, but don’t have the cash to buy a course? Sign up for our FREE trading course that will help you with the mentality and psychology of trading, not just basic chart patterns that you can google easily! Click here to sign up.

Do you use VWAP on your charts? Have you found any success with it? Let me know below!


Open post

OTC Markets Group Inc. – Day Traders’ Dictionary

The OTC Markets Group is the owner and operator of the most substantial U.S. inter-dealer electronic quotation and trading system for over-the-counter (OTC) securities. It provides marketplaces for trading 10,000 OTC securities, making it the third-largest U.S. equity trading forum.

The OTC Markets Group breaks their financial markets down into three tiers, distinguishing companies based on the quality and quantity of the companies’ disclosure and financial information. this division provides different levels of transparency and risk for investors.


OTC Markets Tier Structure

OTCQX: is the top tier of the three marketplaces for the OTC. Stocks that trade on this exchange must meet very strict qualification criteria compared to the other levels. This market includes a large number of blue chips stocks from Europe, Canada, Brazil, and Russia. These large foreign stocks are frequently global household names. Penny stocks, shell companies, and companies in bankruptcy cannot qualify for a listing on the OTCQX.

OTCQB: also known as “The Venture Market,” this is the middle tier of the 3 marketplaces of the OTC. This exchange consists of early-stage and developing U.S. and international companies that are not yet able to qualify for the OTCQX. The company must be current in their reporting, undergo annual verification and certification, meet a $0.01 bid test, and may not be in bankruptcy to meet eligibility standards. Companies listed here report to a U.S. regulator such as the SEC or Federal Deposit Insurance Corporation. The OTCQB replaced the Financial Industry Regulatory Authority (FINRA)-operated OTC Bulletin Board (OTCBB) as the main market for trading OTC securities that report to a U.S. regulator. As it has no minimum financial standards, the OTCQB includes shell companies, penny stocks, and small foreign issuers.

OTC Pink: Also known as “Pink Sheets” is the lowest tier exchange that the OTC Markets Group offers. This marketplace offers to trade a wide range of equities through any broker and includes companies in bankruptcy, financial destress, default, or even non-existent companies whatsoever (shell companies). OTC Pink has no disclosure requirements, so the categorization of  these companies is based solely on info provided by them.

OTC stocks can be very lucrative if traded properly, based on the fact that they are so low priced. It is a lot easier for these types of stocks to spike significant percentages (50%, 100%, 500%) since they are a low lower priced and a lot less liquid. However, they can drop just as fast:

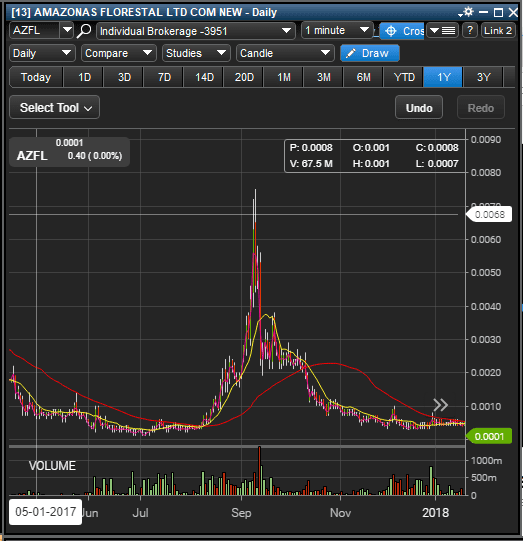
Here is $AZFL, an OTC Pink company that ran from around .0006 to just about .0077 in less than 2 months, leading to gains of over 1000%. When it lost momentum though, it dropped like a rock and presented no real exit opportunities for people who chased. Now it is sitting at .0001, meaning anyone who held the bag through this play has lost all of their money.


When trading OTC stocks, its very important to understand that they trade vastly different than NASDAQ listed or AMEX listed stocks, due to the fact that they do no have electronic automated market makers to facilitate transactions. OTC stocks are generally a lot less liquid, meaning that it can be very hard to exit your position without subjecting yourself to a lot of slippage.


99% of these companies will eventually fail, so never get ‘married to the news’ or hold on to a loss hoping for a bounce!

Want to learn more about trading stocks, and, more specifically, how to trade stocks the right way? Register now for our free masterclass that we are hosting this week: There are only a few seats left!

Open post

Breakout Trading – Day Traders’ Dictionary

Breakout: A stock price moving above a defined level of resistance with increased volume.

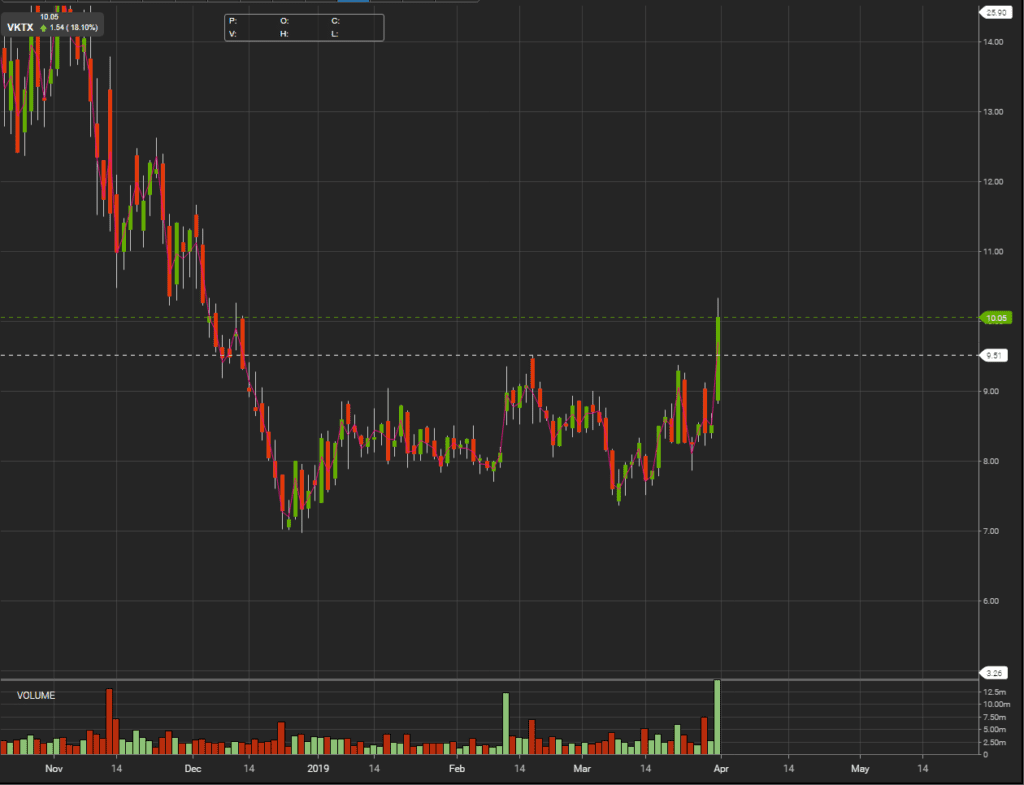
A breakout traders’ strategy is to initiate a long position after the stock price breaks above the resistance level. The key to trading breakouts is to focus on big, obvious chart breakouts (multi-day, multi-month, and multi-year work best, as well as breakouts over the premarket high)

Breakouts occur in all types of market environments, but of course there is a higher probability of successful breakouts happening in times of high market volatility. It is extremely important to understand that not all candlestick breakouts are the same and to focus on refining your breakout strategy to avoid being caught in a fake breakout.

Get the Top 10 Trading Strategies PDF + Free Trading Workshop!

Premarket High Breakout:

The premarket high breakout is a simply strategy that is best used on low float stocks with some sort of catalyst, and good volume. The goal is to initiate a long position once the price breaks over the premarket high ($8.17) with good volume, then to take profits as seems fit. If the breakout fails, you must cut the loss immediately as a rejection of the premarket highs will send the stock into an All Day Fade.


Multi-Month Breakout:

This is another type of breakout that works well for swing traders, as they tend to span out for multiple days. (this does not mean that these breakouts are bad for day traders! The strongest breakouts tend to happen when a stock breaks a HUGE level of resistance that has formed over months/years)


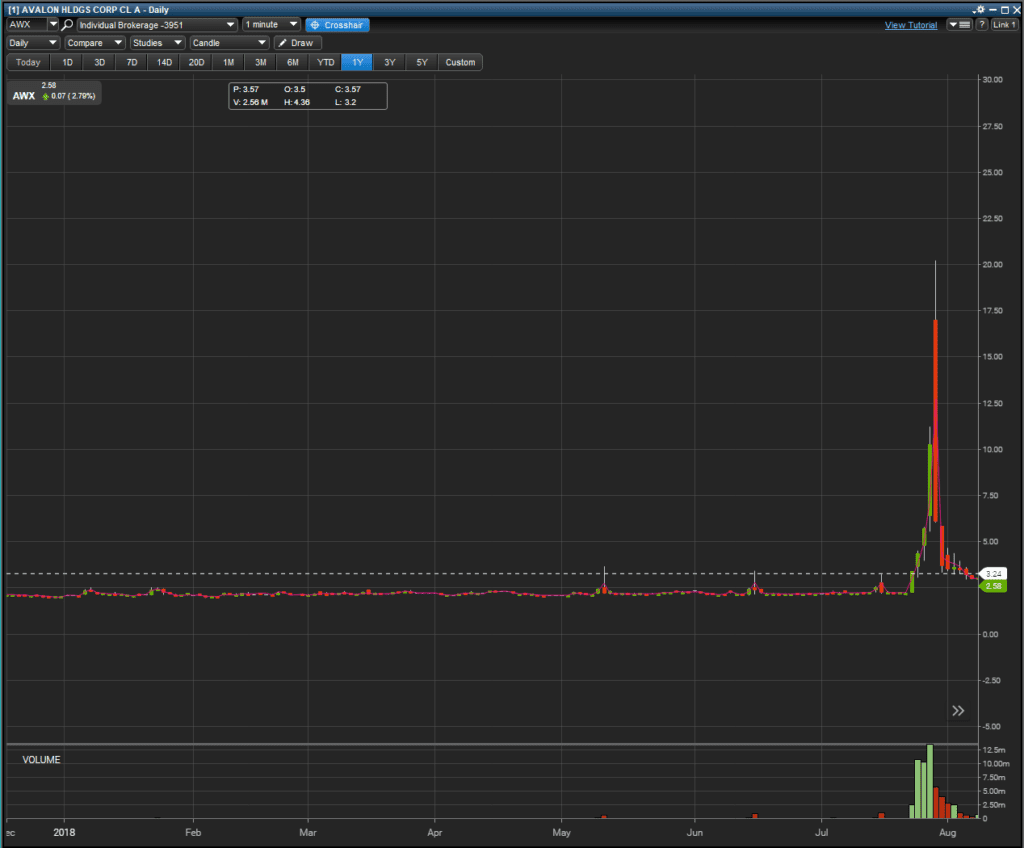
Notice how the low float stock $AWX had a huge multi-month resistance form at around 3.24. Once the stock got a catalyst and received a huge influx of volume, it was able to break above 3.24 and run to $20.00! Note that once the volume dies off, the stock WILL DROP. It is not something that you want to hold on to forever, it will end!


Fake Breakouts

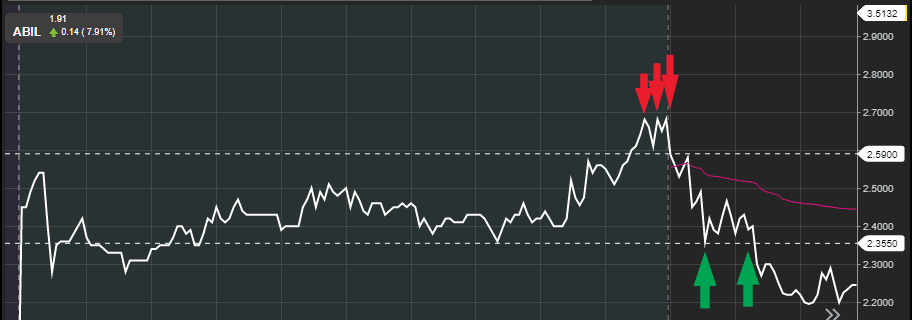
Not every breakout will lead to a successful trade (just like any other strategy, nothing works 100% of the time.) This is why it is extremely important to instill proper rules within your trading, such as cutting your losses quickly and basing your trades around a profitable risk:reward ratio.


Notice that even though the price was able to break the previous high at 2.59, there was still too much resistance (sellers) and it rejected the breakout. Once the rejection happens, the price will likely continue to fall and test the support level.

The Bottom Line

Breakout Trading is a very simple way to start creating your trading strategies. It is very critical to understand what fuels the breakout, meaning understanding if the stock has a catalyst behind it. This can be positive news behind the company itself, overall positive news within the industry that the company operates in, or simple volume from the chart pattern itself.

It is extremely important to instill a proper trading strategy behind the trade, and utilize proper risk:reward management in order to stay consistent with this strategy.

You can find out more about the breakout strategy and proper risk management in our free trading workshop. It includes 3 training videos, a PDF of the top strategies to trade, and a cheat sheet to help plan your trades.

Have you been profitable with breakouts? What breakouts work best for you? Leave a comment below!


Open post

Pattern Day Trader – Day Trading Dictionary

PDT Rule: Is a rule enforced by the Securities and Exchange Commission (SEC) that is given to traders who make four or more day trades in their margin account over a five-day period. A day trade is when you buy and sell a security within the same trading day.

PDT Rule Mechanics


Once your account is labeled as a Pattern Day Trader, you’ll be required to maintain a balance of at least $25,000 for 90 days to make any day trades.  If you are unable to meet this requirement, you will be forced to open up another margin account with a different broker, or go with a cash account altogether. When you are using a cash account to day trade, you can place as many day trades as you wish, however you are required to let your cash settle for 2 days after every transaction. For example, if you have a $2,000 account, you can day trade once per day if you use $1,000 per day. The $1,000 on Monday will not be ready to use until Wednesday, but you still have your other $1,000 to use on Tuesday.


You can also get around PDT by opening up multiple margin accounts with different brokers. As long as you reach the minimum deposit amount, you can have as many margin accounts as you wish. This way, with each margin account you have open ,you will have access to 3 more day trades per 5 rolling day period. I personally recommend that if you are not going to focus on short selling, you should go with a cash account. Find out more about which brokers I recommend in my free trading workshop!


What type of brokerage account do you have? Did you even know cash accounts exist? Let us know below!

Open post

Swing Trading – Day Traders’ Dictionary

Swing Trading: A trading strategy where the trader attempts to profit from short term movements in a stock that may last anywhere from one day to a couple weeks in duration.

Traders who swing trade are generally looking at the ‘bigger picture’ of the stock and tend to use critical levels of support and resistance, fundamental analysis, and upcoming news catalysts as their reasonings to swing a stock.

For example, if the government is about to legalize a drug like Cannabis, a swing trader may look to start building positions in multiple cannabis-related companies with the intention that legalization would boost those companies sales, and their stock prices.

Another example is a swing trader simply using levels of support and resistance to decide their entries and exits. These traders typically use longer time frames, such as the 5 minute chart, 30 minute chart, hourly chart, and daily chart. This allows them to avoid the ‘noise’ that comes with a 1 minute chart and easily identify where the true levels of support and resistance are.

Formulating a plan before the trade is essential, just like with any trading style. The swing trader should know exactly at what level they are looking to get in, what level they are looking to take profits, and what level they going to stop out if they are wrong. Without this plan in place, trading is simply gambling, and you likely would have better odds at a casino.

Have you had any success with swing trading? Let us know down below!