
As a beginner day trader, having access to free trading tools is very beneficial. It is important that you are able to save money wherever you can. After all, trading is a business. If you are spending too much money early, you are more likely to join the 95% of traders who fail.
The easiest way to save money is to use free trading tools.
Here are the top 5 free trading tools that are awesome for beginner day traders.
Free Trading Tools #1: Finviz.com
What It Is
Finviz is a web-based stock market research platform that makes market information readily available to traders and investors. The website offers a ton of free tools that you can use to generate trade ideas and find opportunities whether you’re trading stocks, forex, or futures.
I personally use Finviz.com almost every day to find and verify the float of whatever small cap I am trading. I also use it to identify what percent of the float is short, and a few other key metrics.
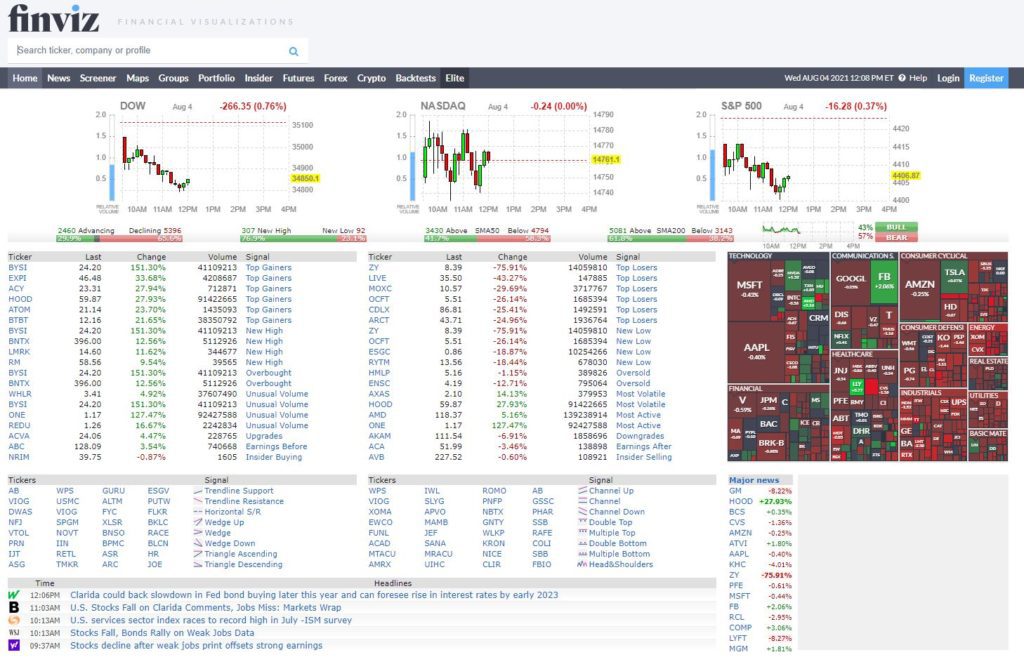
When you first land on Finviz, you’ll see a snapshot of the 3 leading US indexes, a list of the top gainers as well as top losers for the trading day, and lastly an overall view of different industries and how the largest companies within them performed that day.
Finviz.com Stock Summary
If you type in a specific stocks ticker into the top search bar, you’ll be brought to the Stock Summary page.
Here is the Summary for AMC:
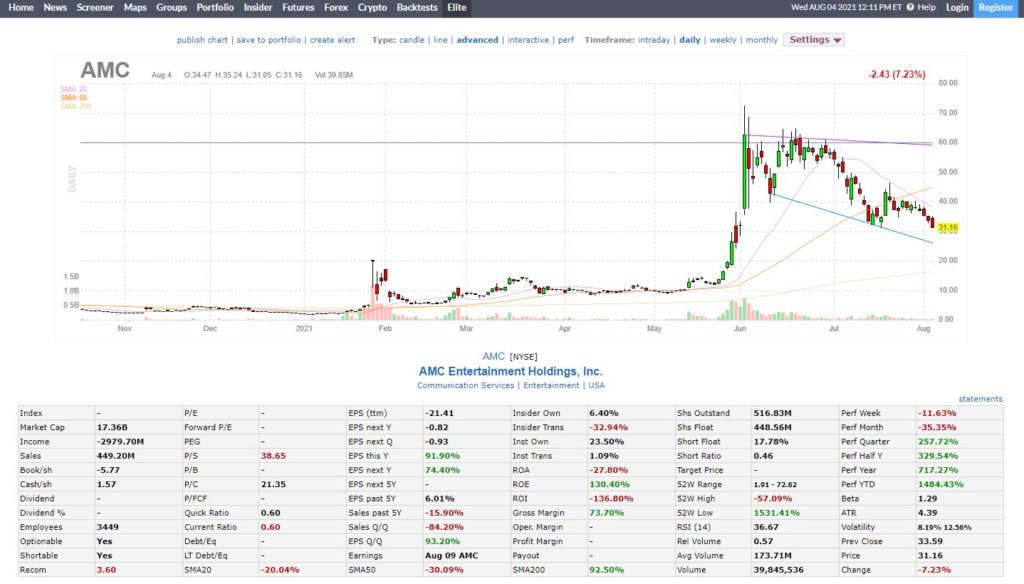
This has almost all the information that you’ll ever need to know for that stock. You’ll see a quick view of its daily chart which is very helpful, and below that you’ll see what sector and broader market they are positioned in. Underneath that there is a huge table with every metric available. Some key ones that I use daily for small cap day trading are Float, Short Float, and Institutional ownership.
As a general key, any stock that has less than 10 million shares in its float is considered a low float and less than 1 million shares would be a micro float. Short float is important to keep in mind, because as the huge squeezes in GME, AMC, EXPR and other r/WallStreetBets meme stocks showed us, retail traders love to pump stocks with a large amount of shorts compared to its float.
If you lean more on the side of swing trading or investing, then there are a lot of metrics here that I’m sure you’d consider in your trading as well. You can see the Book value per share, their dividends, EPS, and a ton of other metrics that you can check out for yourself.
Below all of this information, you’ll see an extensive list of all the news releases and press releases that are tied to this company.
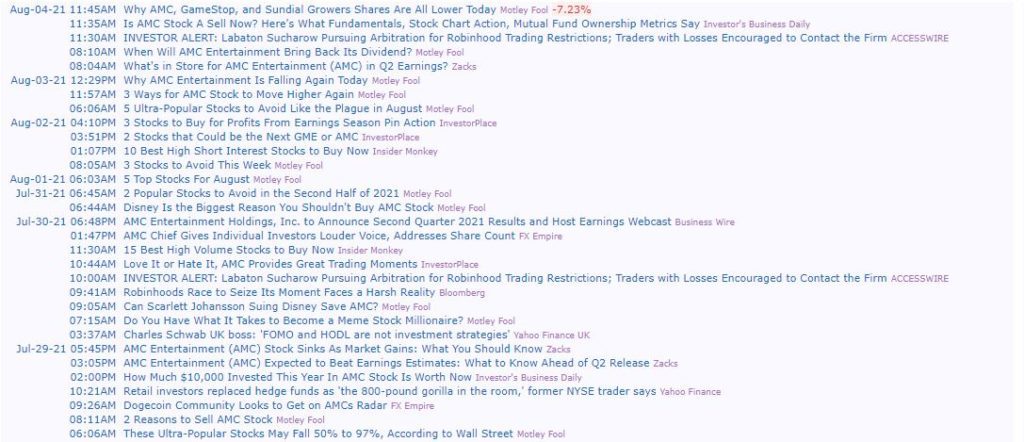
I typically don’t come here for news specifically, but its nice to know that this section exists in case my ThinkOrSwim feed or my BamSEC research is missing something.
Finviz.com Free Stock Screener
The last free trading tool that we’ll cover on Finviz.com is their free stock screener. You can navigate to the stock screener using the top menu bar once you’re on the website.
For being a free screener, this has a ton of parameters that you can filter for, and you can get extremely technical with your scans. I definitely recommend that you go through all of the different filters yourself and decide if any of them would be useful for you to scan for.
My general philosophy with scanners and screeners is to cast a “large net” in order to see a ton of stocks that might have potential. This means that a lot of results in my scans will be duds. However I have learned that being too specific with scanner criteria can cause you to miss stocks that fall just outside of your scans.
For example, you could pretty much copy the exact settings that I use from my Scanz video:
- Exchange: NASDAQ
- Market Cap: -Small (Under $2bln)
- Relative Volume: Over 2
- Float: Under 100m
- Current Volume: Over 200k
- Price: Under $20

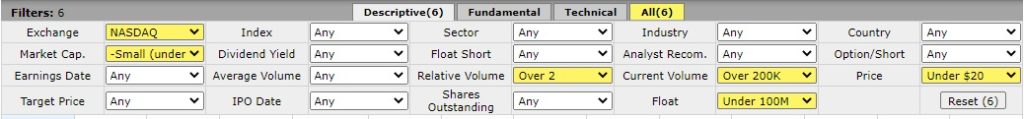
These filters will cast a broad net over a ton of ‘small cap’ stocks that you can then go into individually and research. The scan sorts in alphabetical order of ticker symbols by default. But you can simply press the column headers to rank to your liking. Ranking by volume is the best approach to find actively traded stocks first.
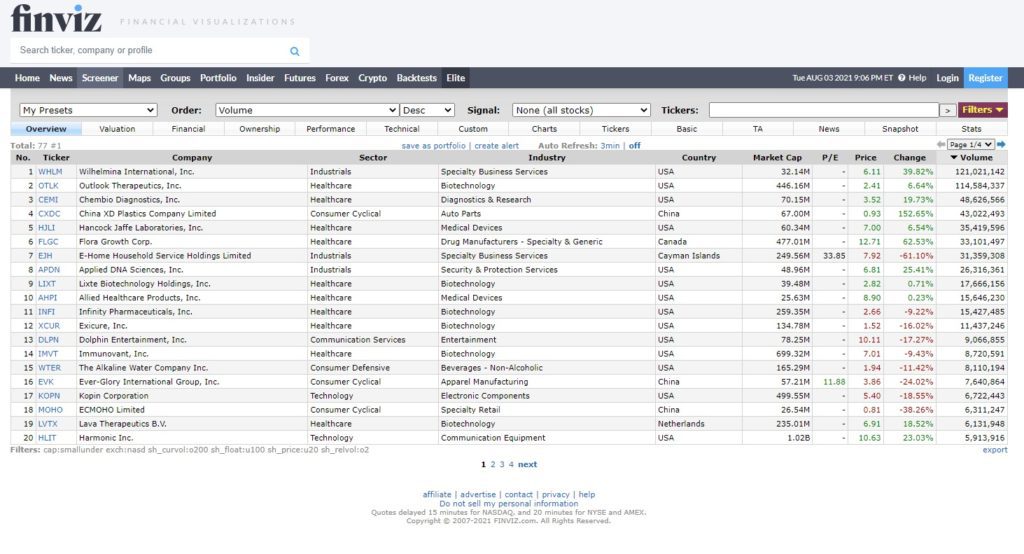
You can take your research a step further by pressing the “charts” tab to view daily charts of all of your scan results.
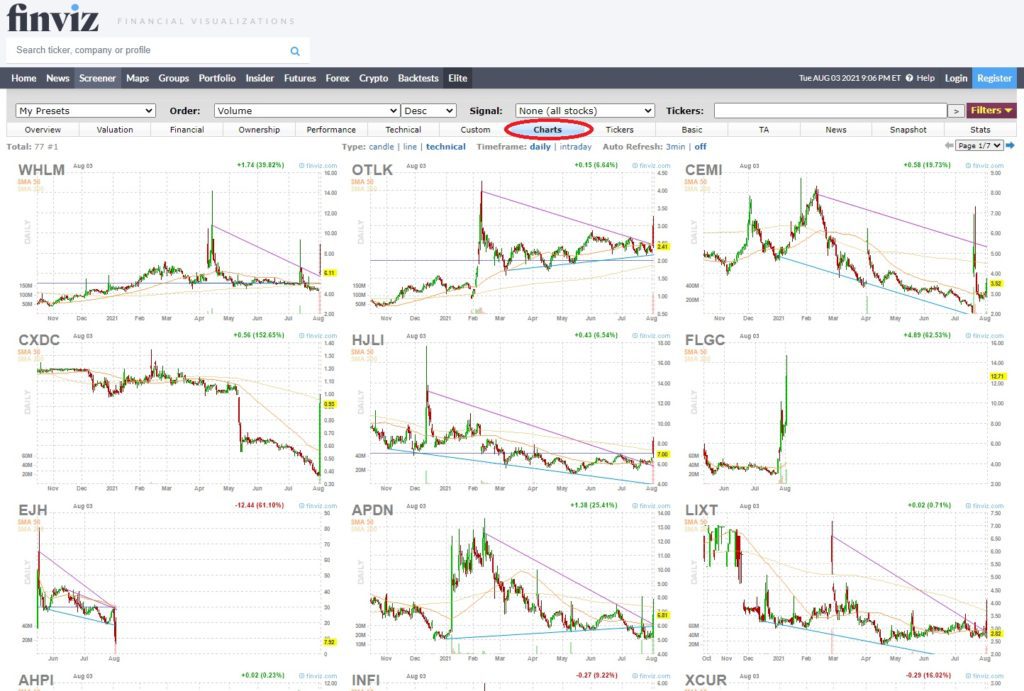
If you don’t want all of the indicators on the chart, just press “Candle” or “Line” and then you can change from Daily, Weekly, or Monthly charts as you desire.
This chart feature is a hidden gem. I have wasted lots of time just by typing in all of my scan results into my brokers’ chart feed, just to be uninterested in like 80% of the charts. Having a quick view of all of the charts immediately can speed up the process for you newer day traders.
You’ll be able to quickly identify if the chart has ‘good potential’ by viewing its trend, seeing how much resistance is overhead, and just be able to get a feel for the price action before you commit to researching the stock further.
Free Trading Tools #2: BamSEC.com
What It Is
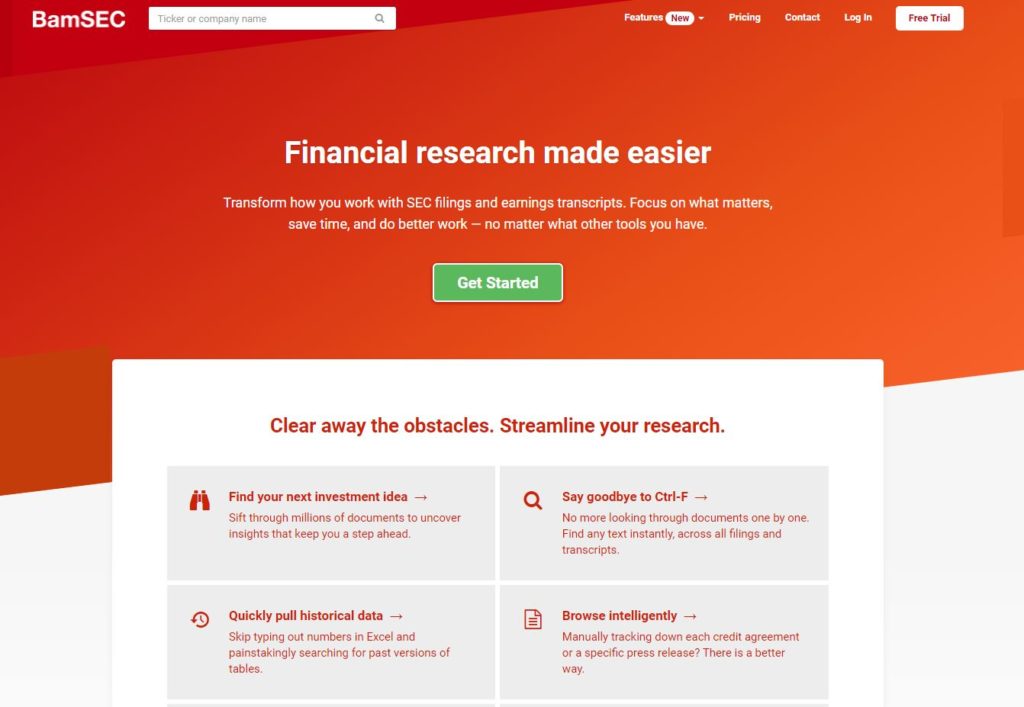
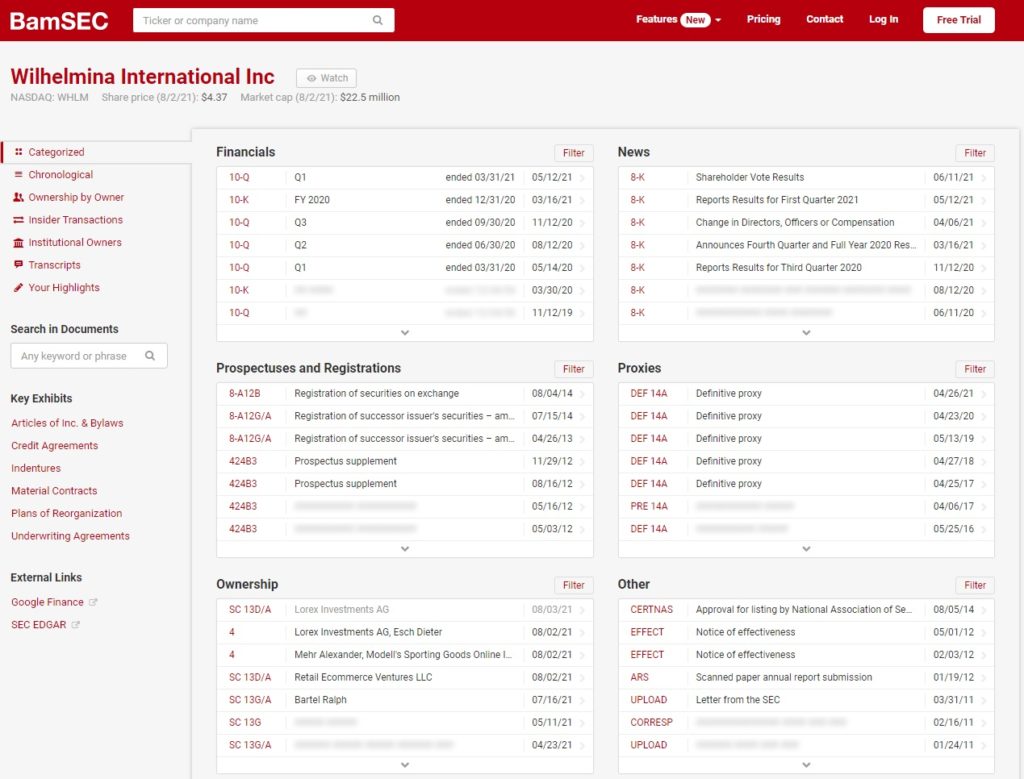
BamSEC is an amazing website, especially for small cap day traders.
This website allows you to view all of the companies SEC filings in a very clear and concise manner.
Back in the day, we use to just have to go to the SEC website and be met with a jumbled mess of all filings in one table, with no easy way to sort through them.
However on BamSEC, filings are split into a few important categories:
- Financials: Quarterly and annual earnings reports
- News: Displays all of the 8k filings for news releases
- Prospectuses and Registrations: View offerings and other types of share dilution
- Proxies: Shows invitations for shareholders to vote on key topics
I’m sure if you’ve had any experience in the market, then you are all too familiar with how common it is to see these companies rob traders of their money through offerings.
The worst part is that, if you just spend a couple minutes researching on BamSEC, then you can identify if companies are in the position to drop an offering soon.
Real Life Example
For example, WHLM’s BamSEC shows that the last prospectus filed was way back in 2014.
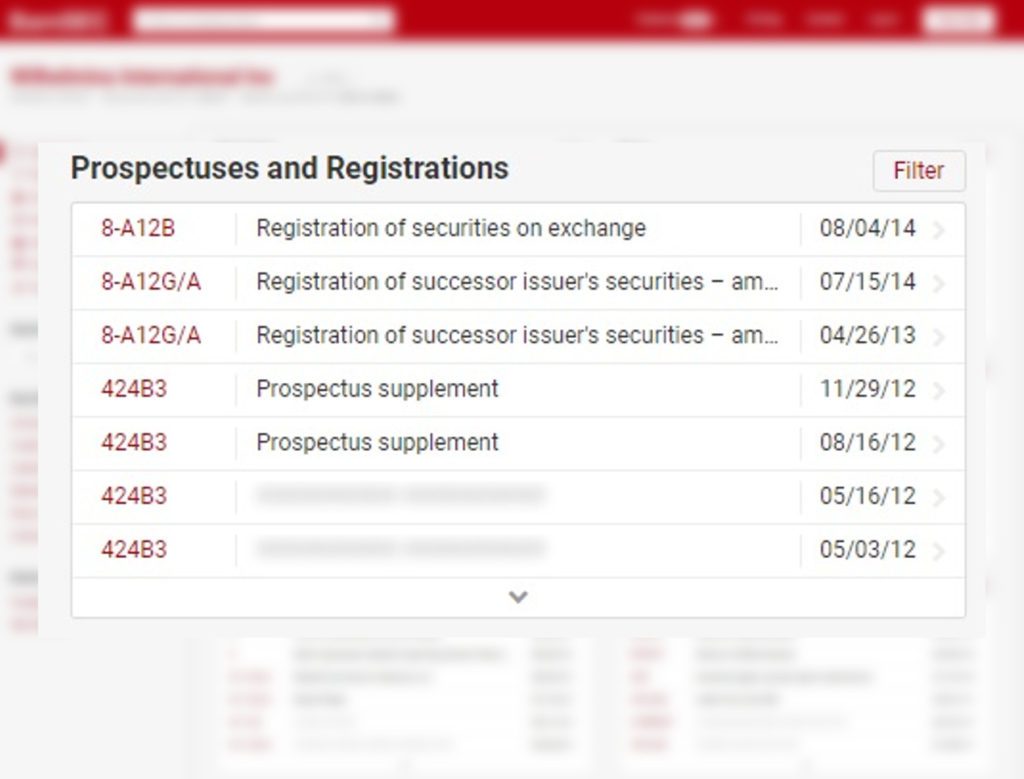
This means they have no active agreements to sell new shares either on the active market or to private investors at a discount. Now this doesn’t mean it’s impossible for the company to do an offering. However it does mean that it is very unlikely for it to happen on the day that you are trading the stock.
Now compare that BamSEC page to MINM’s BamSEC.
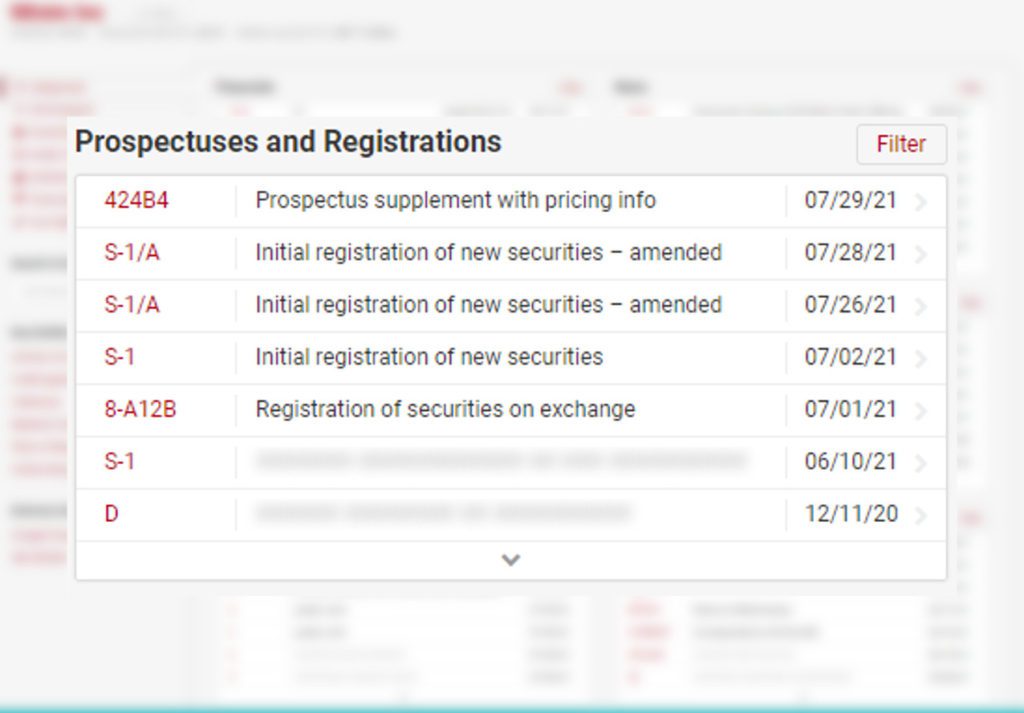
Under Prospectuses and Registrations, you can see that there are many recent filings for registrations of new securities. This is known as dilution. Right away, we know that WHLM has less dilution than MINM. This info can heavily influence your decision to trade a stock. You may even save yourself from a nasty offering.
Free Trading Tools #3: StockCharts.com
What It Is
Stockcharts.com is a free website that traders can use to get an overview of any ticker symbol.
Type a ticker symbol into the search bar to view the daily chart and weekly chart of any stock.
Setting up your stockcharts.com display correctly
Take your analysis a step further by changing from a candlestick chart to a line chart. This is a secret that I use to find levels of support and resistance easier.
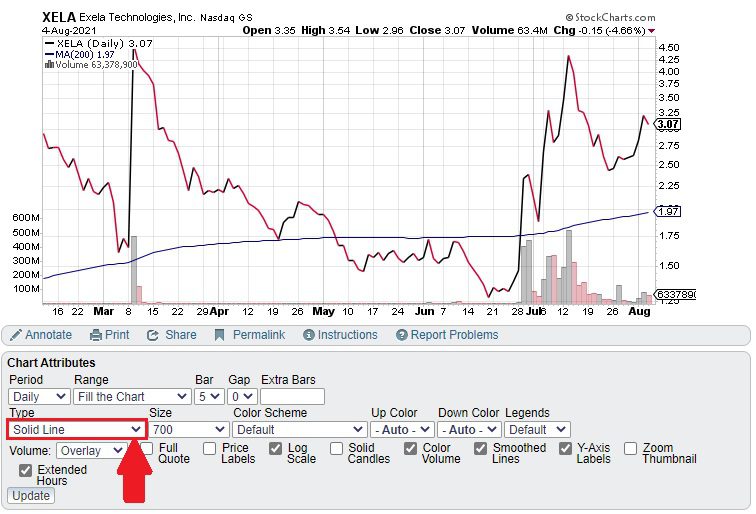
You can also look at both the daily and weekly charts to gather more data.
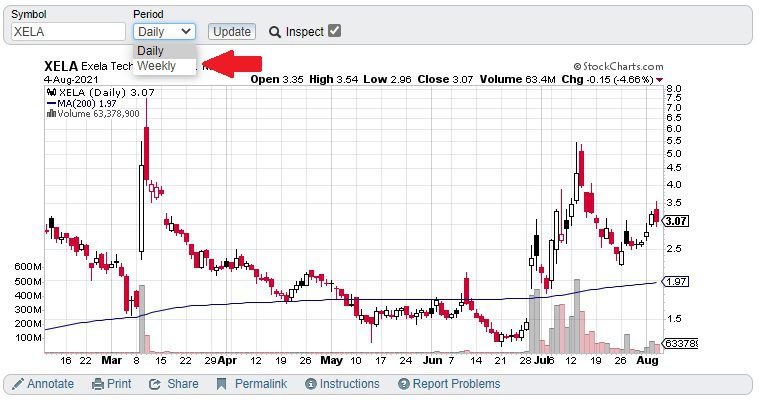
If you want a crosshair to appear on the chart, just press the Inspect checkbox.
Adding indicators to stockcharts.com
Stockcharts.com also has the ability to add indicators and overlays to your charts.
Just understand that no matter how many indicators you have you cannot predict future market movements with complete certainty. Don’t end up with a chart that looks like you spilled spaghetti on it!
There are only 2 overlays that I have used consistently in my trading career:
- 200 Simple Moving Average: Used both on the daily and weekly charts as another type of support or resistance
- VWAP: Used as a level of intraday support or resistance and to judge if a stock is bullish or bearish. Note: I never buy solely because of VWAP!
Other than these two overlays, the only things I care about are price and volume.
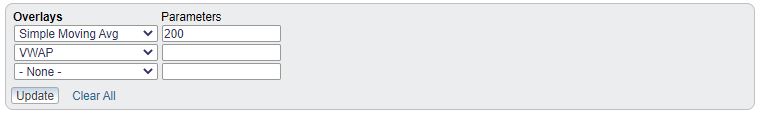
Adding these indicators is very easy to do on stockcharts.com…
Just go below the chart into the overlay section. Then select Simple Moving Average and set its parameter to 200.
Then add another overlay and select VWAP.
Pretty neat right?
One cool thing about the Simple Moving Average is that it is based on the period of candles you select.
When looking at the daily chart we call it the “Daily 200 Moving Average”
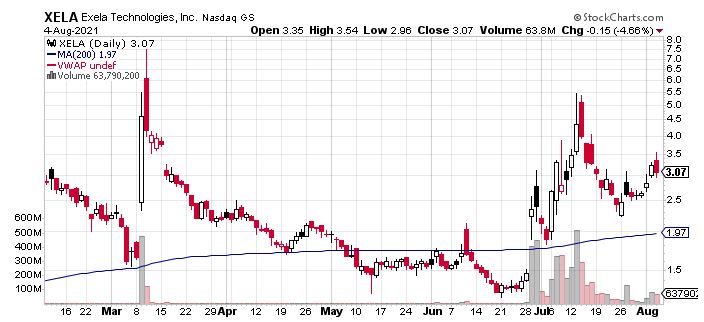
On the weekly it’s considered the “Weekly 200 Moving Average”
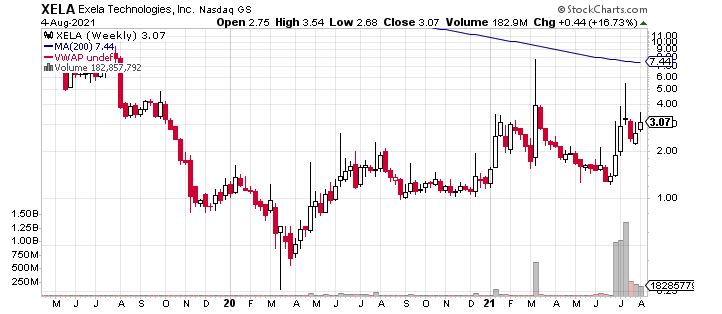
These levels will be different since it is taking an average of the last 200 periods!
Overall, StockCharts.com is a very useful tool for traders. You can use it to practice finding levels of support and resistance on the daily and weekly charts.
Don’t have access to free data through ThinkOrSwim or WeBull? Stockcharts.com is a solid alternative for analyzing the chart.
Just keep in mind that Stockcharts.com has a delay. I would only use it to find levels of support and resistance, or for researching stocks in pre-market or post-market.
Free Trading Tools #4: Webull
What It Is
Webull Financial is a zero commission brokerage firm that has an easy-to-use application on the App Store and Google Play Store.
They also recently came out with a computer application which is pretty well made.
You can open an account with them for free and gain access to extremely useful free tools for trading.

Webull Free Stock Scanner
One of the free trading tools that they offer is a scanner that you can use in premarket and market hours.
This sets apart from Finviz.com because the data feed is real time.
Remember, Finviz.com’s data is 15 minutes delayed!
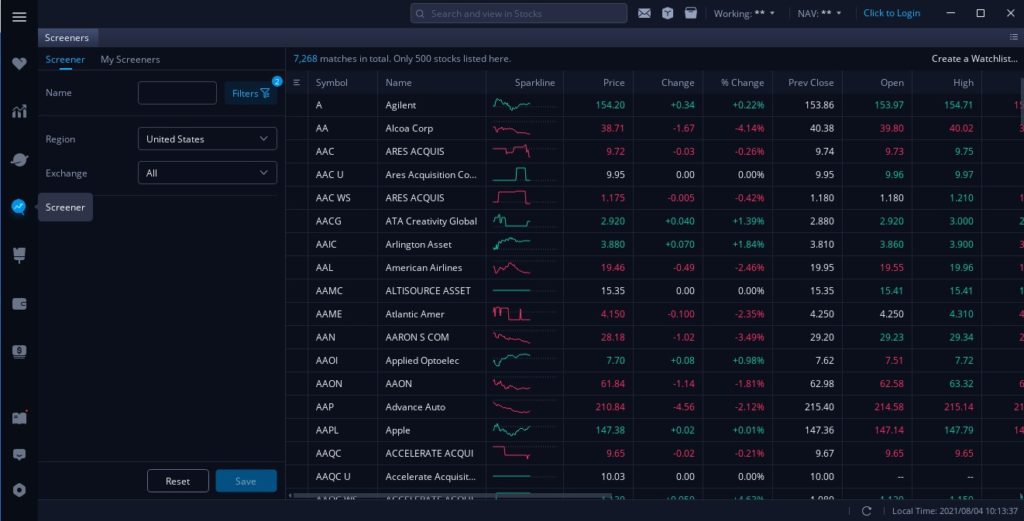
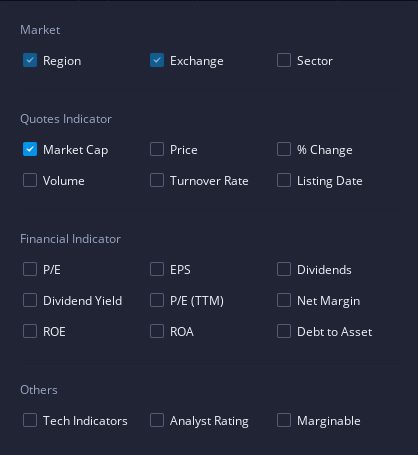
To add filters, simply press the “Filters” menu.
Select parameters in this drop down menu to add to your screener.
Webull Free Paper Trading
You can also paper trade for free on Webull. This is a must-have tool when starting out as a day trader. There is no point to risk your money in the beginning, especially when you haven’t proven yourself yet!
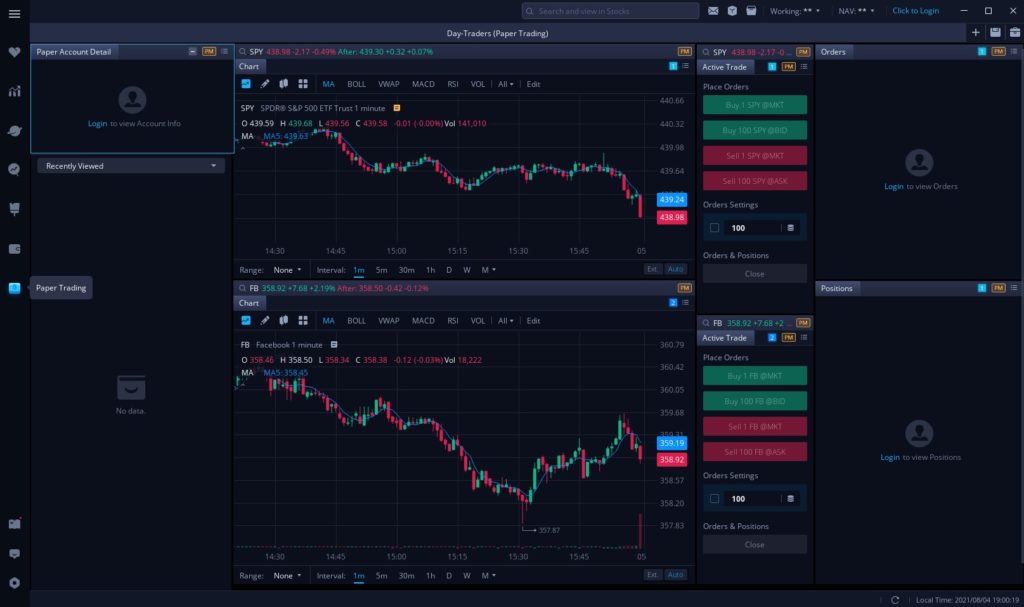
I personally don’t recommend using Webull to paper trade. However, this is only true if you are able to use our next free tool, ThinkOrSwim.
I prefer ThinkOrSwim’s platform over Webull simply because it is the one I use every day. If you are going to be trading real money on ThinkOrSwim, you should use their Paper Trading module as well to become familiar with the layout.
Check out my WeBull Youtube video for a full breakdown of their desktop and mobile app.
Sign up with WeBull using my link and receive 2 free stocks worth anywhere from $100 to $1,000. That’s free money baby!
Free Trading Tools #5: ThinkOrswim Platform
What It Is
ThinkOrSwim is a trading platform by TDAmeritrade targeted towards active traders. Their primary customer base are US and Canadian citizens, however are available in a few other countries too. I have used this platform for the past 3 years and I cannot recommend it enough.
It has basically all the free trading tools you will need in one package. Best of all, it is free to sign up. They also offer free commissions for all listed stock trades. Note that OTC and Options trades do have a commission of $5.95.
Some key features that ThinkOrSwim offers are:
- Paper Trading
- Market Scanning
- “OnDemand” Historical Trading
- Customizable Charts
Just to list a few.
ThinkOrSwim Free Paper Trading
ThinkOrSwim’s paper trading is awesome because it works exactly like their real trading platform. This means once you have proven your skills, you will be using the same exact layout so your execution stays consistent.
If you end up using Paper Trading, make sure to adjust your account size accordingly. The account is $100,000 by default so change it closer to what you will be using once you trade for real.
For example…
If you have $5,000 to trade with, make sure your paper account is also $5,000. You will avoid the big mistake of overtrading and using too much size by doing this.
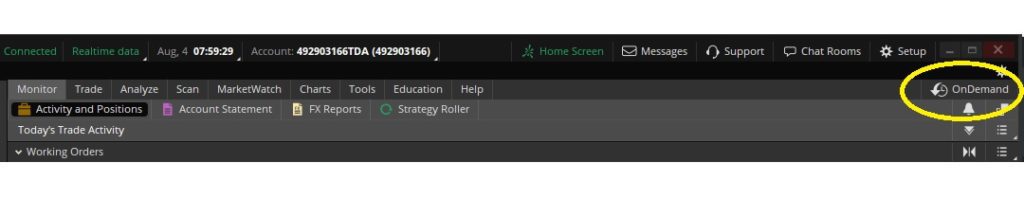
To do this, simply go to “Activity and Positions” under the Monitor Tab. Then press the “Adjust Account” button. You can manually type in the amount desired next to “Set Account Cash To:”
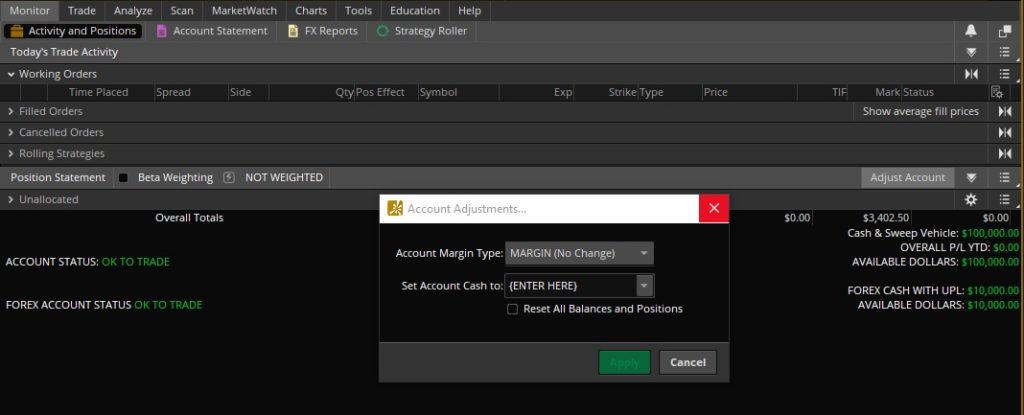
Then hit “Apply” and you’re done!
Check out my YouTube video that breaks all the features down of ToS Paper Trading to learn more tips
ThinkOrSwim Free Market Scanning
Part of the free trading tools package that ThinkOrSwim offers is their scanners. When compared to Finviz’s scanners, it is lacking in a lot of filters that you can use. However a big bonus is that the results are real-time.
This means that you can use it during market hours and avoid the 15 minute delay that Finviz has.
In order to access the scanner, simply press the “Scan” tab and then “Stock Hacker”
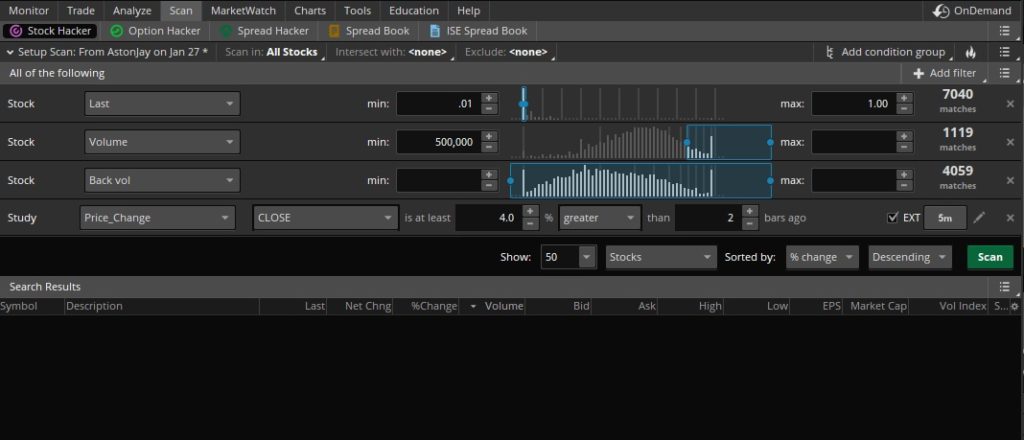
You can add filters by pressing the “+ Add filter” button. Most filters that you will be using are under the “Stock” selection. This will add a row with a drop down menu of a variety of filters. Then, depending on your selection, you add a “minimum” and “maximum” value to scan for.
For example, if I choose Volume and then put a minimum of 500,000 and maximum of 10,000,000…
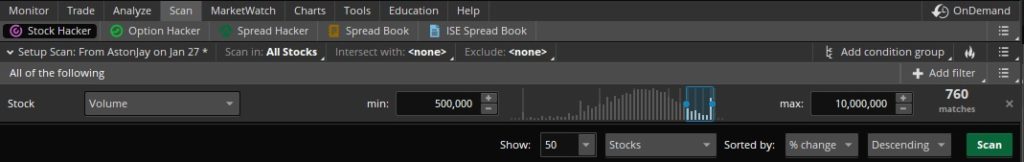
This will return all stocks that fall within that volume range at that moment.
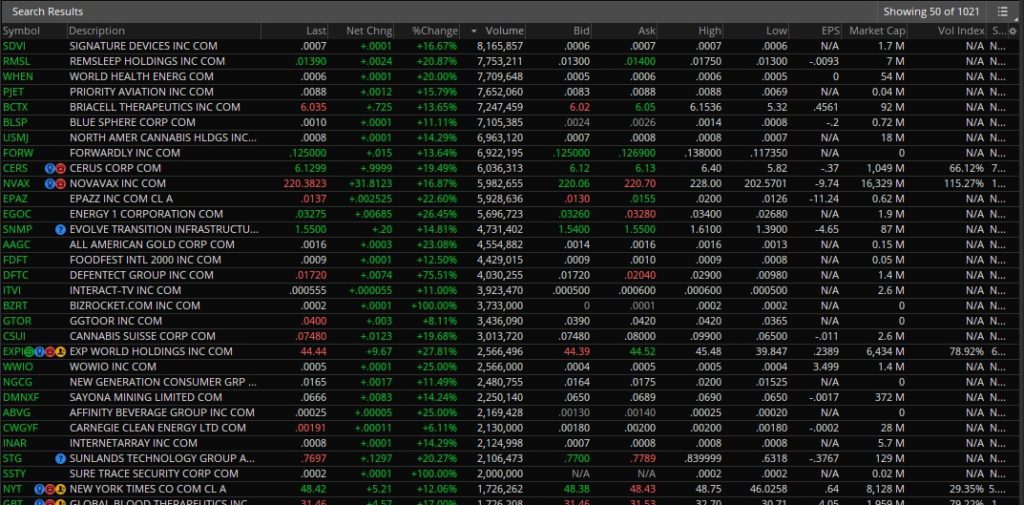
You can enter as many filters as you want in order to specify your scan further.
Some great filters for small cap day traders are
- Price
- Volume
- Market Cap
- Percent Change
To name a couple…
ThinkOrSwim OnDemand Trading
OnDemand is a free trading tool provided by ThinkOrSwim that allows you to back-test your strategy. It lets you replay any trading day from the last several months and practice trading any stock that you choose.
You can run this tool 24/7 so it’s perfect for practicing your executions on the weekends or late at night.
Make sure that you don’t cheat yourself though! There is no sense to use OnDemand if you have already memorized a stock chart’s high and low of the day…
For example…
If you know a spike started at $5.00 and ran to $6.00…
Don’t simply buy at 4.99 and sell at 5.99. Obviously, this isn’t repeatable in real-world trading so you are working towards nothing.
Instead, do your best to ‘forget’ what happened on that trading day, and trade the price action as you see it.
Focus on the execution strategies that we teach in our free trading workshop and you’ll set yourself up for success.
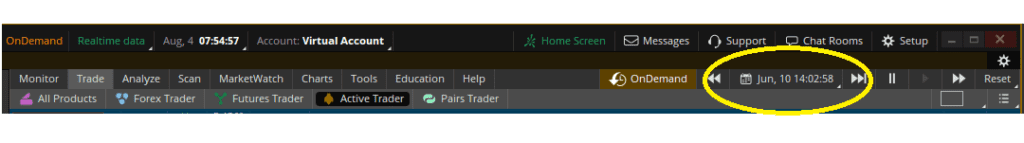
In order to access “OnDemand” first make sure that you are on the “Live Trading” Portion of ThinkOrSwim. Then, simply press the “OnDemand” Button in the top right corner of the platform.
You can then change the date by pressing the calendar drop down. Select a date and then type in the ticker symbol of any stock and you are ready to trade in the past!
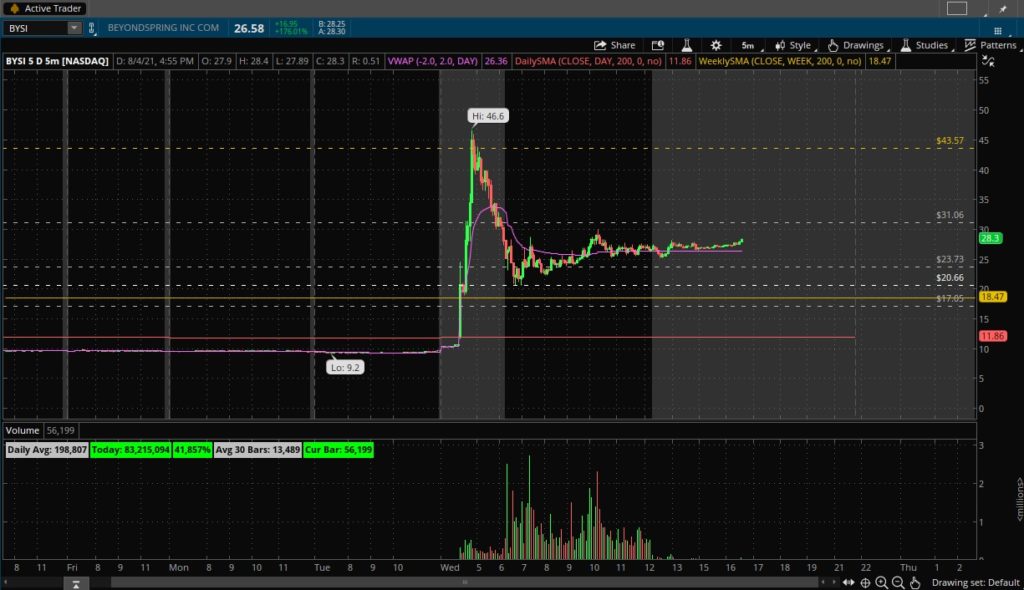
ThinkOrSwims Customizable Charts
Another reason why I highly recommend ThinkOrSwim is the fact that the charts are highly customizable.
You can change pretty much everything.
Background color, color of the candlesticks, color of your levels of support and resistance..
And so much more.
Here’s an example of what my ThinkOrSwim chart looks like:
To change the overall settings on the chart, simply press the Cog Wheel along the top bar.
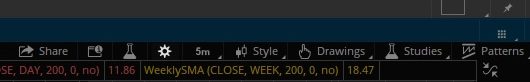
The “Appearance” tab is where you’ll find a lot of the visual settings for the chart.
Here’s what mine look like:
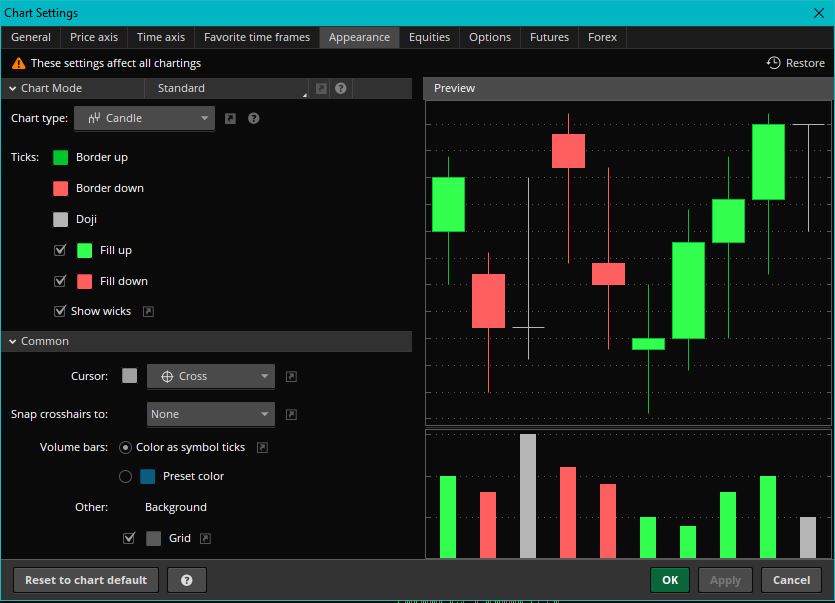
Of course, you don’t have to copy mine exactly. Make sure you style the chart to your own liking.
One pro-tip for using ThinkOrSwim charts is to press down on your mouse scroll wheel while hovering over the chart.
This will bring up your tools menu:
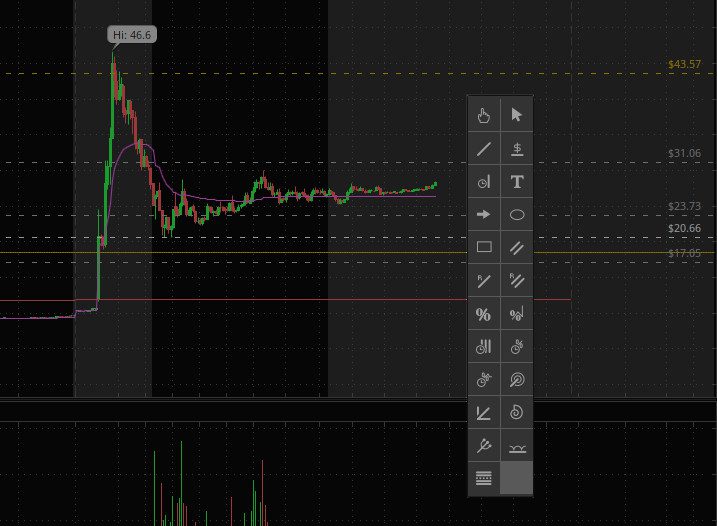
From here, you can draw pretty much everything you would need on a chart.
The main tools that I use on a daily basis are:
- Pan: To drag and move the chart around.
- Pointer: To select different drawings and move or customize them.
- Trendline: To draw a line between two points (useful for measuring percentages)
- Price Level: To draw horizontal support and resistance.
- Rectangle: To box areas of the chart for teaching purposes.
Make sure to go into the settings of each tool you use after drawing them on the chart to become familiar with their options.
For example…
Whenever I draw a support or resistance level, I will edit it and color code it as needed:
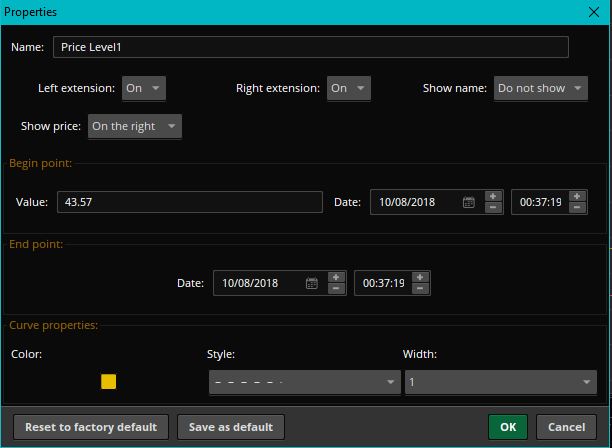
I use red for daily chart levels, yellow for weekly chart levels, and white for intraday levels of support and resistance.
As you can tell, ThinkOrSwim has a ton of features that we can’t cover in this post alone.
If you need more help with ToS, check out this video I created that breaks it down further.
Now It’s Your Turn
I hope this list has helped you in finding free trading tools to use.
Now I’d like to turn it over to you:
What’s the #1 tool from this list that you’ll start to use?
Are you going to use BamSEC to dive into filings easier? Or maybe you’ll start paper trading on ThinkOrSwim to practice your strategy.
Or maybe you have a question about one of these tools, or have another one to share with us.
Either way, let me know by leaving a comment below right now.