Open post

Top 5 Trading Rules You Need To Live By

Trading is inherently dangerous. Everyone knows that. We know that 90% of people who start to trade stocks eventually fail within the first year and most of their losses can be simply attributed to the fact that they didn’t follow any rules. They acted like gunsligners; randomly picking stocks with no systematic approach and hoping for the best.

If you want to gamble, go to Vegas. You’ll have a lot more fun and most likely lose a lot less than if you started trading.

However

If you want to trade PROPERLY and not blow up your account in the first year, then continue reading this article.

Sign up for our FREE trading course

Watch the video below the top 5 rules for trading!


#1: Cut Your Losses Quickly

This rule cannot be overstated enough. I know it seems simple, but its so true: If everyone was simply able to cut their losses quickly, NO ONE would blow up their accounts, and no one would be bagholders. Unfortunately, its an issue that plagues so many new traders. If you cut the loss quickly, yes you lose a tiny amount of money, but small losses are impossible to avoid. As long as your trade was based on a consistent system, then the small loss is just a tiny step back in the long-term.

If you allow a small loss to turn into a huge one, it not only hurts your pocket book, but hurts your soul much more.

You will lose confidence, be upset with yourself, and potentially attempt to revenge trade to make the profits back (which can lead to disaster). Avoid all of this by simply having a risk level in place, and most importantly utilize a hard stop whenever you can. I don’t care if market makers or brokers can ‘see’ my stop; if they decide to take me out then so be it. If this starts to happen on a consistent basis, then that means I simply am entering too early, and look to enter more at the true support.

#2: Trust The Chart!

Never give too much dependence on some sort of indicator or study on the chart.  The hard truth is that every single indicator is calculated from the chart itself. That means, whatever information you’re receiving from the indicator can be also seen just by reading simple price action.

Everyone sees the chart, not everyone sees or respects your indicator.

Have trust in support and resistance, but also understand price action and the trend. Build your knowledge on understanding trends, reversal signals, and signs of front side VS back side. Always base your entries and exits on support and resistance.

Keep this in mind; most (if not all) profitable traders I know mainly rely on price and volume, and maybe have 1 or 2 indicators to confirm what they already know from the chart.

#3: Have A Pre-Trading Checklist

So many new traders have an issue with overtrading, chasing, having FOMO, and overall making terrible entries. The absolute best way to avoid overtrading is to have a pre-trading checklist and STICK TO IT. I offer my pre-trading checklist as a part of my free course here

In order to have a proper trading checklist, you of course need to start identifying and pinpointing exactly what trading strategy you want to go with. Then, you need to narrow the variables and ‘signals’ that you must have checked off before entering the trade.

For example, you must ask yourself questions like:

  • Is this stock within my ideal price range?
  • Does this stock have a good float value?
  • Does this stock have a solid catalyst that will bring volume?

Asking yourself simple questions like this before you give into the adrenaline rush of trading will allow you to proceed with a clear mind and potentially avoid entering impulsively. Remember, stocks ALWAYS pull back, and if you miss this one trade, it won’t be the end of the world. It’s so much better to wait for the ideal moment to position yourself; for your pocketbook and your soul.

#4: Make A Plan Prior To Entering

This rule goes hand-in-hand with having a pre-trading checklist. Just like you should first verify that the trade is actually worth taking, you need to also figure out EXACTLY what price you want to enter at, what price you want to cut the loss (otherwise known as risk level) and what price you want to start locking in profits. YOU MUST DO THIS BEFORE YOU ENTER THE TRADE. If you wait until actually entering, you will be emotionally bias and more likely to act greedy, and not cut losses fast. ALWAYS make a plan prior to entering your trade!

It goes without saying that your trading plan should be based on the basic levels of support and resistance that the chart shows. It doesn’t make sense to take profits if the stock is still in a bullish uptrend and is holding support levels. Likewise, it doesn’t make sense to continue holding if the stock is showing signs of back-side and is breaking critical levels of support.

#5: Have A Trading Journal!

This is quite honestly THE MOST IMPORANT rule to follow. Honestly, I wouldn’t even call it a rule, because you shouldn’t even have the option to break it. This is a necessity of trading.

In order to be a consistent trader, you must first be using a consistent system of trading. Using the same strategy, trading the same stocks, and having the same mindset while trading. Then, you need to track the progress of all of these trades over time, and see your profitability numbers. Average % win, average % loss, win rate, and so on.

Do you REALLY think that you’ll be able to do this from memory?

OF COURSE NOT.

Every single trade MUST be tracked and then reflected on at a later date.

If you don’t do this, I promise you that you won’t be consistent. Every single professional trader that I have asked has a trading journal, and if you want to join their ranks, you will need one as well. Just like my trading checklist, I also provide a template for a trading journal to use in Excel as a part of my free training course. Check it out, learn how to be a profitable trader, and gain access to the top tools required in order to do so all for free.

What trading rules do you live by? Let me know in the comments below!


Open post

What Is VWAP & How To Use When Trading

Volume Weighted Average Price (VWAP): A benchmark indicator that gives the average price a security has traded at throughout the day, based on both volume and price.

VWAP is a very powerful indicator, and is in fact one of the only indicators that I use on my charts when I trade. If used correctly, it can provide deep insight into the current structure of ‘the move’ and allow you to effectively maximize your profit potential and at the same time, help you understand when it is time to jump ship and exit the trade. Keep in mind that the content on this page is meant for small cap day trading, specifically low float stocks. In the video below, I will explain exactly what the VWAP indicator is and how it’s calculated, and how to use vwap when day trading small cap penny stocks.

Sign up for our FREE trading course

Watch the video below for an in-depth explanation of VWAP!


How VWAP Looks:

The pink/purple line  on the chart above is the VWAP indicator when displayed on E-TRADE PRO charts


Key Takeaways

  • The Volume Weighted Average Price (VWAP) appears ONLY on intraday charts (1 min, 5 min, 15 min, etc.) and will NOT show up on daily charts.
    • Because of this, VWAP calculations are reset at every market open
  • In general, if the stock is above VWAP, it is considered bullish, if it is below vwap, it is considered bearish
  • Don’t rely on VWAP exclusively to determine price action and trend, be sure to utilize basic support and resistance principles as well


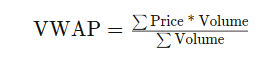
VWAP formula

Using VWAP to read price action


One important thing to understand about VWAP is that it resets at every market open. This means that, in general, the volume and price action during the morning will dictate which way VWAP will go. (Think of it as the morning volume is weighted more heavily since it is the starting vol for the calculation)

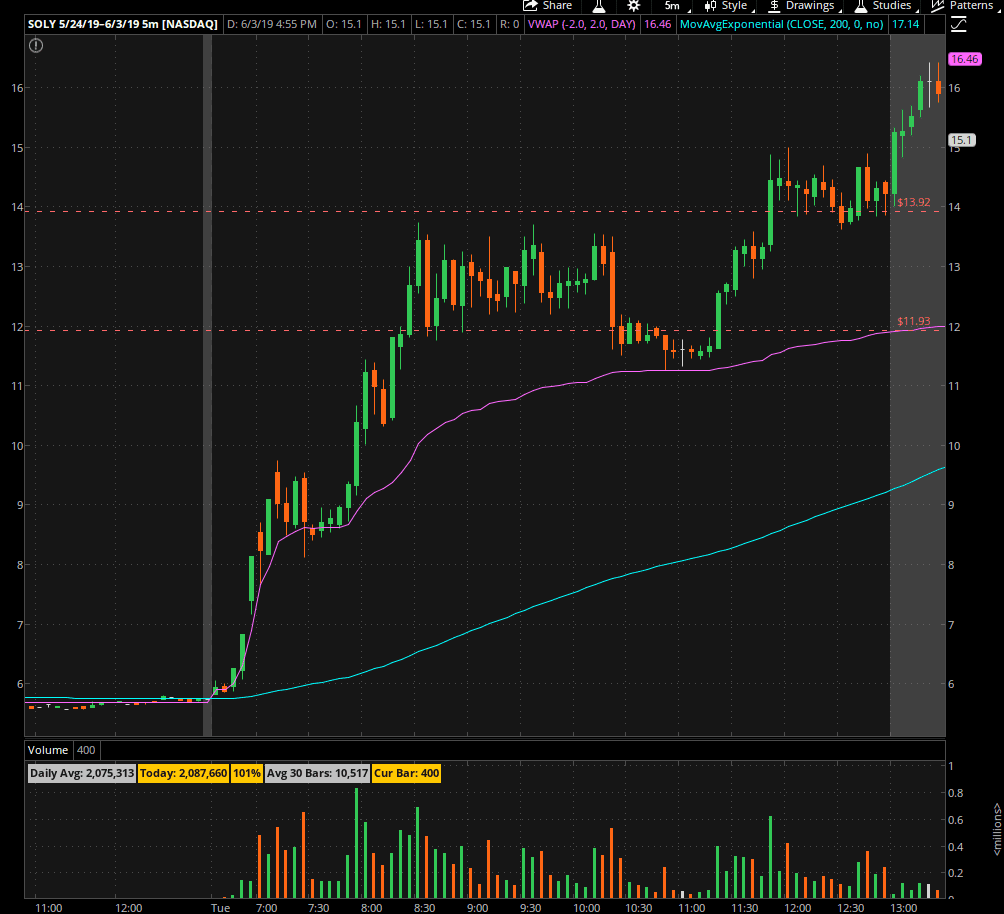
For example, take a look at SOLY on the right. The purple/pink line is the VWAP, and volume is listed at the bottom. In the morning, there was extremely high volume followed by a huge surge in price. Within the first hour or so, the stock spiked from $6 to around $14 on large volume. You can see that because of this massive morning volume, the VWAP was able to stay close to the price and give it support on the way up.

Another thing to note about this chart is how VWAP acted as support at 2 critical points on SOLY’s move. This is largely caused by institutional banks and mutual funds choosing to enter at VWAP since it is considered ‘the point of most liquidity’

As noted before, in general if the stock is above VWAP it is considered bullish, and VWAP can be used as a sort of support level. When the stock is underneath VWAP, it can be considered a resistance level.

Another thing that you can use to your advantage is understanding price action in relation to VWAP. I explain this a lot more in depth with TradeBuddy University students (find out more here…) but, in general, the first big push over VWAP will almost always have a dip down to VWAP. This means that you do NOT need to sell at the first signs of a pullback, because the stock can very easily pull back to VWAP and then break higher. It is only time to sell once the stock puts in a LOWER HIGH after bouncing vwap, and then cracks the VWAP line.


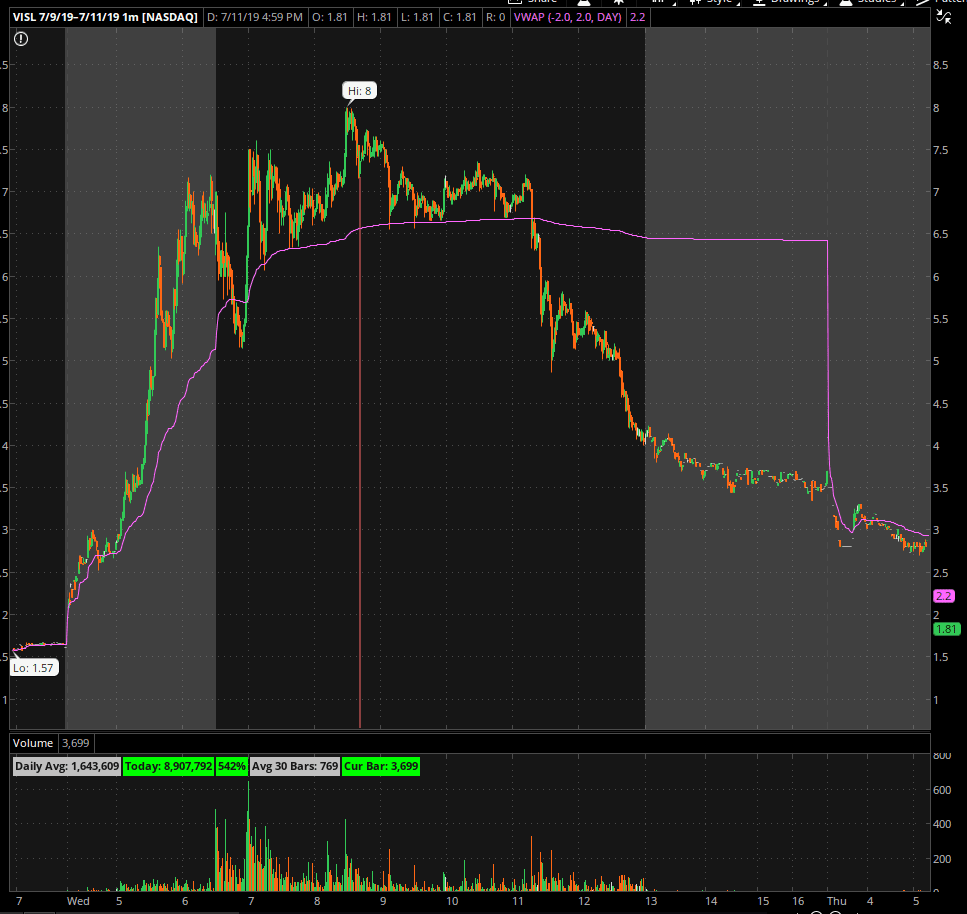
VISL is another good example of how VWAP can be considered support and resistance, and can help you identify the ‘backside’ of a move; when the stock is truly done for.

Notice that after it hit highs of $8.00 and started to make a descending triangle against VWAP. If I saw this happening live, I would prepare to get stopped out if it breaks VWAP, because that would be a bearish downtrend move. Once it finally broke the VWAP on significant volume, it tanked a ton. Usually, whenever we see a crack from front-side to back-side, we see a bounce that rejects VWAP (thus confirming the new trend) but in some cases, when the sell-off is simply too strong, there will not be a bounce.


I hope this helps you understand a bit more about price action in relation to VWAP and how you can use it to your advantage when trading. Remember, VWAP can only be used on intraday time frames, so don’t freak out if it is not showing up on your daily chart.

Want to learn more about trading, but don’t have the cash to buy a course? Sign up for our FREE trading course that will help you with the mentality and psychology of trading, not just basic chart patterns that you can google easily! Click here to sign up.

Do you use VWAP on your charts? Have you found any success with it? Let me know below!


Open post

OTC Markets Group Inc. – Day Traders’ Dictionary

The OTC Markets Group is the owner and operator of the most substantial U.S. inter-dealer electronic quotation and trading system for over-the-counter (OTC) securities. It provides marketplaces for trading 10,000 OTC securities, making it the third-largest U.S. equity trading forum.

The OTC Markets Group breaks their financial markets down into three tiers, distinguishing companies based on the quality and quantity of the companies’ disclosure and financial information. this division provides different levels of transparency and risk for investors.


OTC Markets Tier Structure

OTCQX: is the top tier of the three marketplaces for the OTC. Stocks that trade on this exchange must meet very strict qualification criteria compared to the other levels. This market includes a large number of blue chips stocks from Europe, Canada, Brazil, and Russia. These large foreign stocks are frequently global household names. Penny stocks, shell companies, and companies in bankruptcy cannot qualify for a listing on the OTCQX.

OTCQB: also known as “The Venture Market,” this is the middle tier of the 3 marketplaces of the OTC. This exchange consists of early-stage and developing U.S. and international companies that are not yet able to qualify for the OTCQX. The company must be current in their reporting, undergo annual verification and certification, meet a $0.01 bid test, and may not be in bankruptcy to meet eligibility standards. Companies listed here report to a U.S. regulator such as the SEC or Federal Deposit Insurance Corporation. The OTCQB replaced the Financial Industry Regulatory Authority (FINRA)-operated OTC Bulletin Board (OTCBB) as the main market for trading OTC securities that report to a U.S. regulator. As it has no minimum financial standards, the OTCQB includes shell companies, penny stocks, and small foreign issuers.

OTC Pink: Also known as “Pink Sheets” is the lowest tier exchange that the OTC Markets Group offers. This marketplace offers to trade a wide range of equities through any broker and includes companies in bankruptcy, financial destress, default, or even non-existent companies whatsoever (shell companies). OTC Pink has no disclosure requirements, so the categorization of  these companies is based solely on info provided by them.

OTC stocks can be very lucrative if traded properly, based on the fact that they are so low priced. It is a lot easier for these types of stocks to spike significant percentages (50%, 100%, 500%) since they are a low lower priced and a lot less liquid. However, they can drop just as fast:

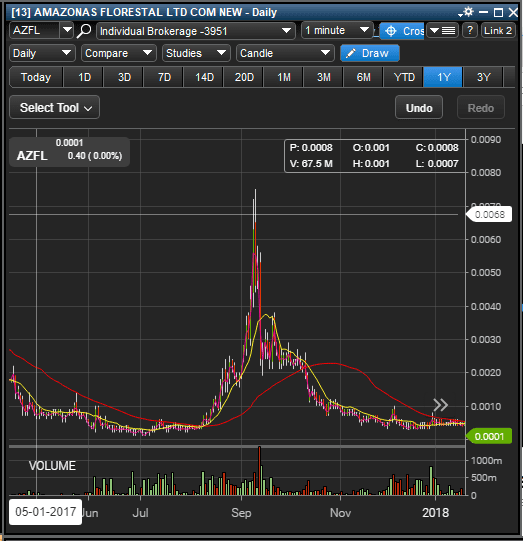
Here is $AZFL, an OTC Pink company that ran from around .0006 to just about .0077 in less than 2 months, leading to gains of over 1000%. When it lost momentum though, it dropped like a rock and presented no real exit opportunities for people who chased. Now it is sitting at .0001, meaning anyone who held the bag through this play has lost all of their money.


When trading OTC stocks, its very important to understand that they trade vastly different than NASDAQ listed or AMEX listed stocks, due to the fact that they do no have electronic automated market makers to facilitate transactions. OTC stocks are generally a lot less liquid, meaning that it can be very hard to exit your position without subjecting yourself to a lot of slippage.


99% of these companies will eventually fail, so never get ‘married to the news’ or hold on to a loss hoping for a bounce!

Want to learn more about trading stocks, and, more specifically, how to trade stocks the right way? Register now for our free masterclass that we are hosting this week: There are only a few seats left!

Open post

Breakout Trading – Day Traders’ Dictionary

Breakout: A stock price moving above a defined level of resistance with increased volume.

A breakout traders’ strategy is to initiate a long position after the stock price breaks above the resistance level. The key to trading breakouts is to focus on big, obvious chart breakouts (multi-day, multi-month, and multi-year work best, as well as breakouts over the premarket high)

Breakouts occur in all types of market environments, but of course there is a higher probability of successful breakouts happening in times of high market volatility. It is extremely important to understand that not all candlestick breakouts are the same and to focus on refining your breakout strategy to avoid being caught in a fake breakout.

Get the Top 10 Trading Strategies PDF + Free Trading Workshop!

Premarket High Breakout:

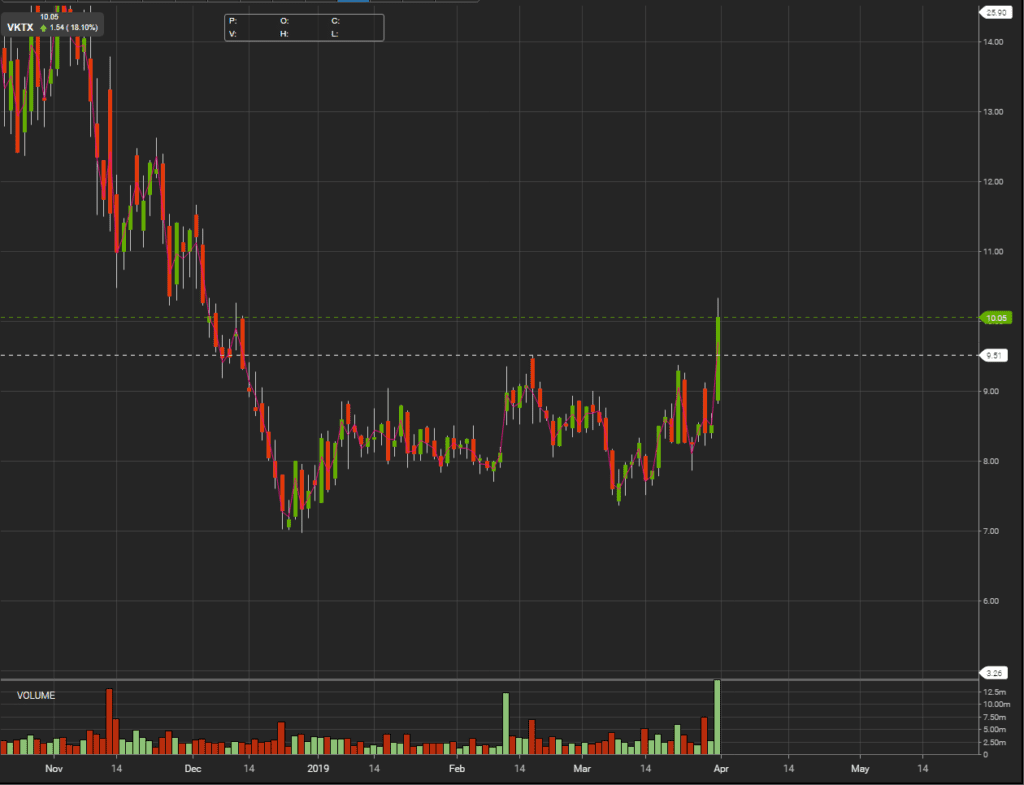
The premarket high breakout is a simply strategy that is best used on low float stocks with some sort of catalyst, and good volume. The goal is to initiate a long position once the price breaks over the premarket high ($8.17) with good volume, then to take profits as seems fit. If the breakout fails, you must cut the loss immediately as a rejection of the premarket highs will send the stock into an All Day Fade.


Multi-Month Breakout:

This is another type of breakout that works well for swing traders, as they tend to span out for multiple days. (this does not mean that these breakouts are bad for day traders! The strongest breakouts tend to happen when a stock breaks a HUGE level of resistance that has formed over months/years)


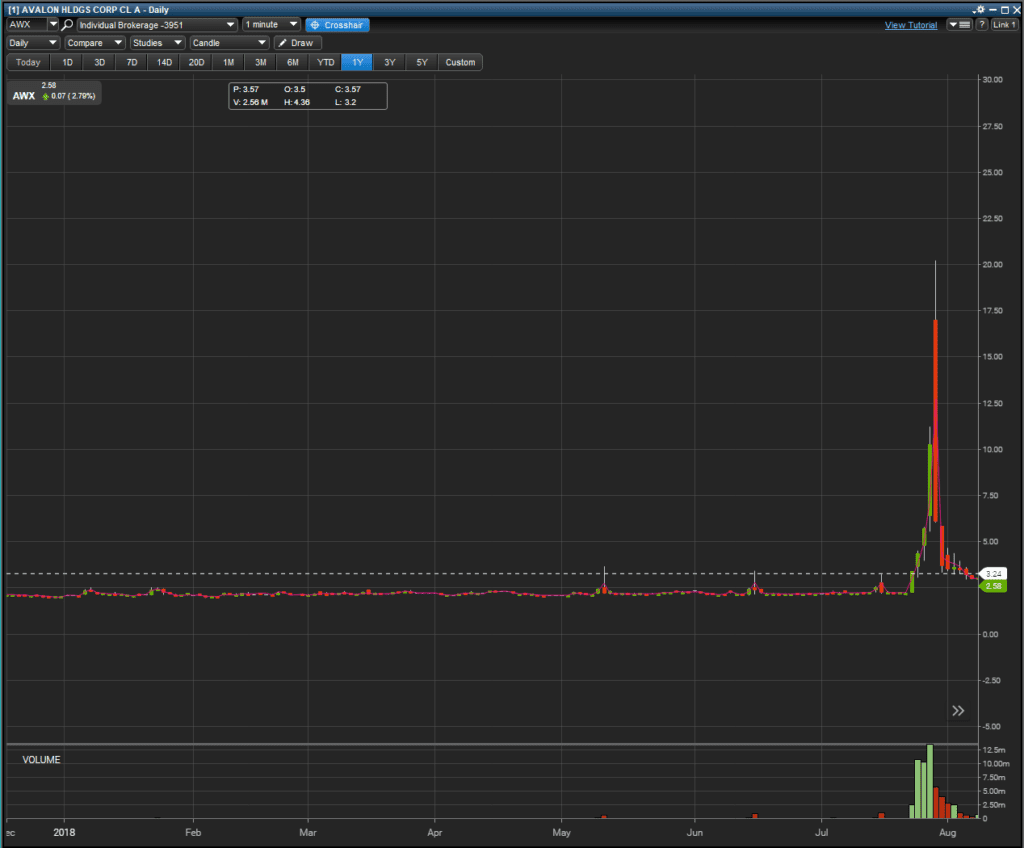
Notice how the low float stock $AWX had a huge multi-month resistance form at around 3.24. Once the stock got a catalyst and received a huge influx of volume, it was able to break above 3.24 and run to $20.00! Note that once the volume dies off, the stock WILL DROP. It is not something that you want to hold on to forever, it will end!


Fake Breakouts

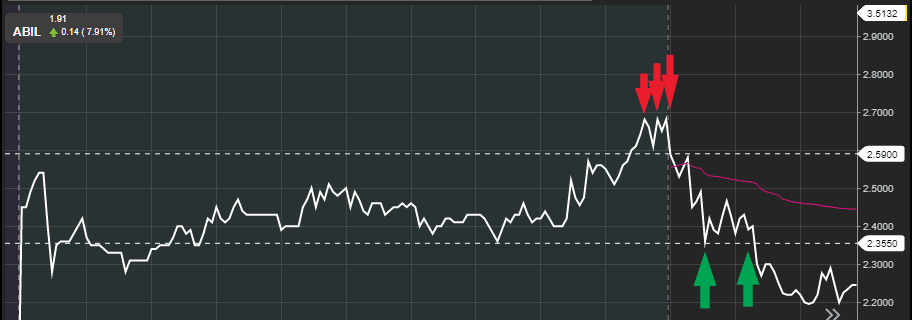
Not every breakout will lead to a successful trade (just like any other strategy, nothing works 100% of the time.) This is why it is extremely important to instill proper rules within your trading, such as cutting your losses quickly and basing your trades around a profitable risk:reward ratio.


Notice that even though the price was able to break the previous high at 2.59, there was still too much resistance (sellers) and it rejected the breakout. Once the rejection happens, the price will likely continue to fall and test the support level.

The Bottom Line

Breakout Trading is a very simple way to start creating your trading strategies. It is very critical to understand what fuels the breakout, meaning understanding if the stock has a catalyst behind it. This can be positive news behind the company itself, overall positive news within the industry that the company operates in, or simple volume from the chart pattern itself.

It is extremely important to instill a proper trading strategy behind the trade, and utilize proper risk:reward management in order to stay consistent with this strategy.

You can find out more about the breakout strategy and proper risk management in our free trading workshop. It includes 3 training videos, a PDF of the top strategies to trade, and a cheat sheet to help plan your trades.

Have you been profitable with breakouts? What breakouts work best for you? Leave a comment below!


Open post

Pattern Day Trader – Day Trading Dictionary

PDT Rule: Is a rule enforced by the Securities and Exchange Commission (SEC) that is given to traders who make four or more day trades in their margin account over a five-day period. A day trade is when you buy and sell a security within the same trading day.

PDT Rule Mechanics


Once your account is labeled as a Pattern Day Trader, you’ll be required to maintain a balance of at least $25,000 for 90 days to make any day trades.  If you are unable to meet this requirement, you will be forced to open up another margin account with a different broker, or go with a cash account altogether. When you are using a cash account to day trade, you can place as many day trades as you wish, however you are required to let your cash settle for 2 days after every transaction. For example, if you have a $2,000 account, you can day trade once per day if you use $1,000 per day. The $1,000 on Monday will not be ready to use until Wednesday, but you still have your other $1,000 to use on Tuesday.


You can also get around PDT by opening up multiple margin accounts with different brokers. As long as you reach the minimum deposit amount, you can have as many margin accounts as you wish. This way, with each margin account you have open ,you will have access to 3 more day trades per 5 rolling day period. I personally recommend that if you are not going to focus on short selling, you should go with a cash account. Find out more about which brokers I recommend in my free trading workshop!


What type of brokerage account do you have? Did you even know cash accounts exist? Let us know below!

Open post

Swing Trading – Day Traders’ Dictionary

Swing Trading: A trading strategy where the trader attempts to profit from short term movements in a stock that may last anywhere from one day to a couple weeks in duration.

Traders who swing trade are generally looking at the ‘bigger picture’ of the stock and tend to use critical levels of support and resistance, fundamental analysis, and upcoming news catalysts as their reasonings to swing a stock.

For example, if the government is about to legalize a drug like Cannabis, a swing trader may look to start building positions in multiple cannabis-related companies with the intention that legalization would boost those companies sales, and their stock prices.

Another example is a swing trader simply using levels of support and resistance to decide their entries and exits. These traders typically use longer time frames, such as the 5 minute chart, 30 minute chart, hourly chart, and daily chart. This allows them to avoid the ‘noise’ that comes with a 1 minute chart and easily identify where the true levels of support and resistance are.

Formulating a plan before the trade is essential, just like with any trading style. The swing trader should know exactly at what level they are looking to get in, what level they are looking to take profits, and what level they going to stop out if they are wrong. Without this plan in place, trading is simply gambling, and you likely would have better odds at a casino.

Have you had any success with swing trading? Let us know down below!

Open post

Bearish – Day Trading Dictionary

Bearish: a market mentality in which the investor believes prices will fall

Investors who adopt a bear approach sell (or short) securities under the assumption that they can buy them later at a lower price. Bears are pessimistic investors who are attempting to profit from the downward movement of stocks.

NOTE: When a bearish investor enters a trade, they are considered to be “going short”

How Bear Markets Begin

If you understand anything about how prices move, then you’ll know that a bear market is simply the self-fulfilling prophecy that occurs when people believe that prices will fall due to some outside catalyst. The Bearish traders will sell stocks on the assumption that prices will fall, and prices falling is a direct result of the bearish traders’ selling power.

This belief is then reinforced as the participants in the market continue to push the prices lower despite any negative information, which then validates their belief that prices should be falling.

Bear Traps

bearish investors must be aware of what is commonly known as a bear trap. A bear trap exists when an investor believes a sudden decrease in the value of a particular security is the beginning of a trend resulting in the investor going short. This can lead to a selling frenzy (panic selling!) where, as more investors sell the security, the price continues to fall. Once those interested in selling the security have completed the trades, selling pressure may drop and lead to spiking prices for the security, squeezing all of the shorts out as they realize that they were caught in a bear trap.

As the price rises, bearish investors must choose whether to hold or buy back the security. If investors begin to cover (buy back their shares), the price will continue to raise from new buying pressure. This may prompt a new round of investors to begin covering their holdings and driving the price up even further. In cases where a bear trap did exist, the price of the associated stock often does not return to that lower price (at least for the short term)


As a bearish trader, you are required to understand exactly how to navigate the ‘short’ side of the trade. This can be pretty difficult as demonstrated by the staggering statistic that over 90% of traders fail. One extremely important step to take as a trader is to learn and understand why these 90% of traders failed, and then avoid those mistakes. We break down these mistakes in this free trading workshop, so I suggest you sign up now and learn!

Open post

Bullish – Day Trading Dictionary

Bullish: A market mentality in which the investor believes prices will rise

Investors who adopt a bull approach purchase securities under the assumption that they can sell them later at a higher price. Bulls are optimistic investors who are attempting to profit from the upward movement of stocks.

NOTE: When a bullish investor enters a trade, they are considered to be ‘going long’

How Bull Markets Begin

If you understand anything about how prices move, then you’ll know that a bull market is simply the self-fulfilling prophecy that occurs when people believe prices will rise due to some outside catalyst. The bullish traders will buy stocks on the assumption that the prices will rise, and prices raising is a direct result of the bullish investors’ buying power.

This belief is then reinforced as the participants in the market continue to push the prices higher despite any negative information, which then validates their belief that the price should be rising.

Bull Traps

Bull investors must be aware of what is commonly known as a bull trap. A bull trap exists when an investor believes a sudden increase in the value of a particular security is the beginning of a trend resulting in the investor going long. This can lead to a buying frenzy (FOMO!) where, as more investors purchase the security, the price continues to raise. Once those interested in purchasing the security have completed the trades, demand may drop and lead to plummeting prices for the security.

As the price declines, bull investors must choose whether to hold or sell the security. If investors begin to sell, the price may experience further decline. This may prompt a new round of investors to begin selling their holdings and driving the price down even further. In cases where a bull trap did exist, the price of the associated stock often does not recover.

As a bullish trader, you are required to understand exactly how to navigate the ‘long’ side of the trade. This can be pretty difficult as demonstrated by the staggering statistic that over 90% of traders fail. One extremely important step to take as a trader is to learn and understand why these 90% of traders failed, and then avoid those mistakes. We break down these mistakes in this free trading workshop, so I suggest you sign up now and learn!

What kind of trading do you lean towards, bullish or bearish? let us know in the comments below!
Open post

Bagholder – Day Traders’ Dictionary

Bag Holder: Someone who holds onto a position when it goes against them for an extended period of time, causing extremely large and unnecessary losses.

This happens when a trader enters a position and it goes quickly against them and they freeze because they didn’t plan for the potential loss before they got into the trade. When this happens, traders will likely hold on to their position in hopes of it coming back, however, what usually happens is the stock keeps going against their position and they lose even more money. Remember, “Hold and hope” is not a strategy!

There are a lot of reasons why traders will hold onto a losing position, but the main one is fear of losing. Nobody wants to be a loser. Not me, not you. It’s in our blood to want to be successful. So when trades go against us, we go against our better judgement and turn a losing trade into something much, much worse.

It is so easy to avoid becoming a bag holder as all you need to do is cut the loss quickly (which is exactly what I preach in this free trading workshop) however so many individuals who get into trading are not willing to accept the fact that they will only win around 60% of the time. As a result of this, none of them have a plan for what to do when the trade goes against them, which means that once the trade DOES go against them, they have no idea how to react.

This is the psychological aspect of trading that new traders tend to have a hard time with. They hope it will turn around and the moment they do this they are putting emotions before logic and reason.

#1 rule is to cut your losses quickly ALWAYS and be sure to have a plan in place before you trade so that you know exactly where you are getting in, taking profits, and cutting the loss!

Want to learn more of the most important rules of trading? Sign up for our free Trading Workshop! You’ll also get access to the Top 10 Trade Setups of 2019 [PDF]

Day Trade – Day Trader’s Dictionary

Day Trade: To buy and sell a stock within the same day in order to capitalize on a stocks price movement.

So, for example, If I were to buy shares of Apple, Inc. ($AAPL) on Monday, I would have to sell it on the same day for it to be considered a day trade.

This little bit of information is important because US Citizens are subject to the Pattern Day Trader Rule. This rule restricts anyone who has less than a $25k Margin Account from placing more than 3 day trades within a rolling 5 day period. If you break this rule, you will be forced to swing trade ONLY until you deposit $25k into your trading account.


Want to know how to get around the PDT Rule? Click Here

Day traders usually fall into 2 categories: Long-biased traders and Short-biased traders. Most of us here at TradeBuddy are long biased traders, but we do have some amazing short biased traders. Its good to learn both types of trading so that you can use reverse psychology to find exactly where the ‘other side’ of the trade will act the most emotional.

There are a ton of different trading setups and strategies that people use to do this, but it’s important to understand that just because a setup works for someone else, does not mean that it will work for you. Traders are individuals who have different ways of thinking and perceiving information, which can greatly affect how you will trade compared to someone else.

Some strategies contain a ton of risk, while others have less perceived risk but require to you be lightning fast. Others can be slower trades altogether; there are a thousand different ways to make money in the market and your only job is to find a few ways to do it consistently. It takes time to develop your own setups that best fit your personality, which is why we highly recommend Paper Trading before risking your hard earned cash.