The Definitive Guide To Day Trading In 2020
This is the ultimate guide to Day Trading in 2020.
Let me be clear about something:
This is NOT your average "Buy The Breakout" trading guide.
We will be covering how the big banks and institutions enter and exit trades.
If you want to make money trading, then you have to move with the big money.
You're going to see new strategies that are working great right now.
So if you're looking to improve your Day Trading this year, you'll love this new guide.
Contents
-
Day Trading Basics
-
Important Trading Terminology
-
Proper Stock Selection
-
Starting With Paper Trading
-
Trade Profitability Analytics
-
Optimize for the Entire Move
-
Master Your Trading
CHAPTER 1:
Day Trading Basics
Day Trading trading is a very misunderstood term.
Most people think you need to be taking hundreds of trades per day.
This is simply not the case.
Today, the best day traders only take a few trades a day, max.
Typically, day traders don't necessarily trade every day.
In many ways, we spend more time waiting than we do trading.
And in this chapter I'll cover everything you need to know about this important trading trend.

"What is Day Trading?"
Day Trading is the process of buying and selling stock within a single day, which helps you lock in consistent profits. Day traders require on volatility and volume to give them enough range to make the trade worthwhile. One big advantage of day trading is that you do not have to have your money in the market for a long period of time, which reduces your overall risk.
One thing to understand is that without the proper education, you are likely to lose.

In fact, we did a case study recently amongst 5,034 traders.
We found that:
What you learn in the first 6 months greatly impacts your profitability.

And when comparing traders who invested into their education versus ones that didn't...

They had a 82% higher chance of becoming successful traders.
So, as you can see, this is not something that you can just 'jump right in to'.
With that being said... lets move on.
What Determines A Stocks Price?
Surprisingly, a ton of individuals have zero understanding of why stock prices move.
Its actually quite simple.
If you've taken an Economics class, you're probably familiar with supply and demand.
Not familiar with that concept?
It basically means that price is determined by the meeting point of where suppliers want to sell an item and where buyers are willing to pay for an item.
For example..
")
If you need an in-depth lesson on supply and demand, check out this article
The graph above shows that buyers and sellers meet at the price point of $6
Meaning..
Sellers believe that their apples are worth $6 and are willing to sell.
And buyers believe that apples are worth $6 and are willing to buy.
For stocks, this works exactly the same.
In general.. people will buy a stock if they believe the price will go up in the future....

Sellers will sell a stock if they believe the price will go down in the future...

Notice how this brings in an element of speculation?
This concept is very important, and is explained a lot further in my mentorship programs.
How does a Stocks Price Change??
A stock's price changes when the supply and demand graph changes.
To put it simply,
If the supply increases (amount of sellers increase) than the price will drop.

If supply decreases, than the price will rise.

Likewise,
If the demand increases (amount of buyers increase) than the price will rise.

Likewise,
If the demand increases (amount of buyers increase) than the price will rise. And if it decreases, than the price will fall.
Why do people buy and sell stocks?
Fundamentally understanding the reasoning behind why someone is entering or exiting a trading position can MASSIVELY increase your edge in the market.
In the simplest sense, people will buy or sell a stock depending on how it affects their cash.
Now.. imagine this scenario
What if someone bought 1000 shares of a company at $1.00 each because he believes the price will raise to $1.50 and he can sell for a $500 profit.
However, he ended up being wrong and the stock dropped to $0.50 per share. Obviously, this individual would be panicking since he's down $500! This person obviously doesn't want to sell because "Its not a loss if you don't sell" so he holds and hopes for the price to bounce.
Eventually, the stock bounces back up to $1.00...
What do you think this person will be compelled to do?
Do you think he will hold and hope that he can turn it into a green trade?
Or will he sell for break-even, since he doesn't want to experience the emotional pain that he suffered when he was down $500?
Maybe he will hold and see if it can get above $1.00, but if it falls back below, he will sell so he doesn't have to suffer again.
In all of these scenarios, one thing remains certain. His decision is compelled by the price in which he invested into the stock.
This is the fundamental reasoning behind one of the most popular Technical Analysis rules:
"Previous resistance will hold as new support, and previous support will hold as new resistance."

This same thing happens when someone sells a stock because they believe it will not go any higher..
And then the stock goes higher anyways.
Since they don't want to miss out on the opportunity cost, they will be compelled to buy back in once the stock reaches the level they initially sold at.
Heres an illustration to make this simpler..

CHAPTER 2:
Proper Stock Selection
Proper stock selection is one of the most important parts of day trading.
You could do everything else right, but mess up this one step.
Today, the best day traders only take a few trades a day, max.
Typically, day traders don't necessarily trade every day.
In many ways, we spend more time waiting than we do trading.
And in this chapter I'll cover everything you need to know about this important trading trend.
What Types Of Stocks To Trade
There are many types of stocks to day trade.
You could choose from:
- Big Chips
- Index Funds
- Futures
- Small Caps
- OTC
This guide will focus on Small Cap day trading.
The reason for this, is that small caps can generate MASSIVE returns compared to big chip companies.
For example:
The S&P 500 took an entire year to grow 40%
And that's if you timed the bounce perfectly.
<Insert SPY infographic>
Meanwhile, this small cap stock in the Coronavirus sector ran 100% in 15 minutes.
100% in FIFTEEN minutes!
You can see the extreme bonus of choosing small caps for your small day trading account.
Your gains will compound and your account will grow exponentially.
There are 3 important criteria to look for when choosing a stock to trade.
1. Catalyst.
We learned earlier that stocks will move higher if most traders buy because they believe it will return a higher price in the future...
The event that triggers these beliefs are called catalysts.
There are 3 main types of catalysts that we focus on as day traders:
- News Catalysts
- Technical Catalysts
- Fundamental Catalysts
News Catalysts
News Catalysts are the most common. This occurs when there is news released that directly affects the company.
For example.. Imagine a company that is valued at $14 million releases news stating that they have acquired a new contract that will generate them $35 million per week.
Clearly, this company is now valued much higher than it was before they had this contract. People are likely to buy this stock since the news shows the company can grow a lot into its future.
This isn't a hypothetical scenario either, this actually happened in 2020.

As you can see from the graphic above, the tiny company known as SCWorx Corp. ($WORX) released very positive news right in the midst of the Coronavirus epidemic. The world is in dire need of anti-body testing kits to figure out exactly who has had the virus in the past (meaning they're immune) to better understand when countries can start 'operating' again.
Before this news was released, SCWorx's market capitalization was only $14 million dollars...
In a single day, SCWorx went from $2.20s to a high of nearly $15 per share
That's an increase of over 563%!!
In general, the most important aspect to news is the reaction to the news.
Remember, the news itself is not what is causing the stock to move, its how traders and investors are reacting to the news.
A stock can have the greatest news release in world, but if people don't see it or don't care about it, the stock won't move or might even go lower. On the flip side, a stock can have very bad news, but if its not as bad as people expected, it has a chance to move higher.
Always consider what is happening with the bigger picture and always consider the other factors surrounding a stock before making a decision with your trade.
Technical Catalysts
Technical catalysts are also extremely common when it comes to small cap day trading. Technical catalysts relate to Technical Analysis, the practice of studying and interpreting data from the stocks' chart, price, and volume to determine what the stock is likely to do in the future.
If you've been studying trading at all, then i'm sure you're very familiar with terms like chart patterns, technical breakouts, and candlesticks.
The reason why things like breakouts and breakdowns happen is due to what we discussed earlier. People are forced to act in one way or another if they are losing opportunity cost.
People buy breakouts into a stock's all time highs because they don't want to feel the pain of missing a larger move.
They sell breakdowns into a stock's all time lows because they don't want to feel the pain of holding a massive loser.
These patterns being widely taught have led it to becoming a self-fulfilling prophecy, where the patterns work because most traders believe them to be true.
With this being said, no pattern can 100% predict the future movement of a stock.
I personally never buy or sell based on one chart pattern alone.
Instead, I use them to guide my thought process of what the stock is doing, and use them to judge the stock's bigger picture.
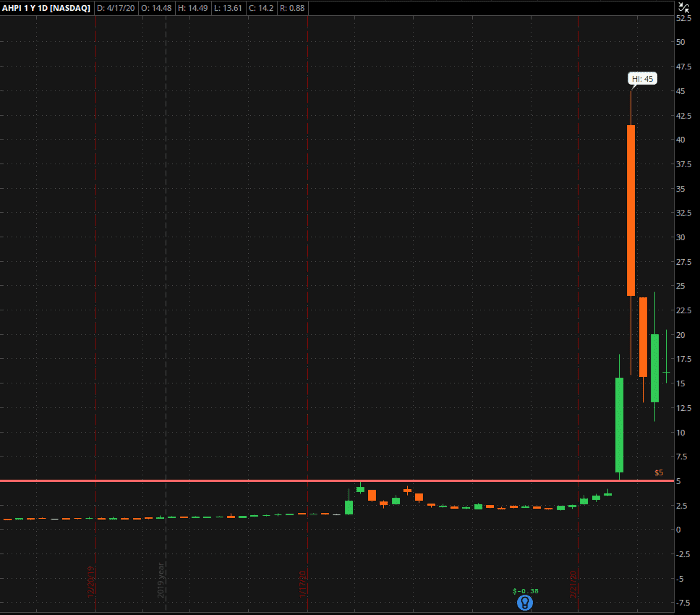
As shown by the horizontal line on the chart above, Allied Healthcare Products, Inc. ($AHPI) had a huge resistance level at $5.00 per share. Eventually, the stock was able to break out over $5.00 and caused the stock to go on a massive run all the way to $45.00 per share! That's gains of 800% on this single breakout.
This technical breakout was largely fueled by the fact that people did not want to miss out on its big breakout move, as well as sellers being trapped in a massive short squeeze. Retail traders and institutions alike kept selling AHPI as it broke out, but it continued to squeeze higher and emotionally forced those people to buy back in.
When it comes to technical catalysts, they have the highest odds of success when they happen on larger time frames, and are extremely obvious breakout levels.
For example...
A breakout on the 1 minute chart is completely insignificant, whereas a multi-month breakout into all time historical highs on the daily chart is extremely significant.
The more obvious the breakout is, the more likely it is for multiple people to see the same exact pattern and react impulsively to it.
Remember, the patterns are not what cause the breakouts, its the traders reacting to it. Volume with technical catalysts is extremely important as well.
Industry Catalysts
These types of catalysts are very similar to news catalysts, however instead of the news being direct at one singular stock, the news is direct towards a whole industry of companies. With industry catalysts, you can see many stocks from the same industry spiking on the same day, or dropping on the same day, depending on if the industry catalyst is positive or negative.
Industry catalysts are pretty common and typically end up creating some of the biggest penny stock spikes we've seen over the last 10 years.
For example, here is Longfin ($LFIN) which was a very new company that did an IPO with only a 5 million share float. In 2017 during the height of the Cryptocurrency Mania, they claimed that they had owned a subsidiary that owned a cryptocurrency platform. The stock went from around $10.00 per share to a high of $140.00 per share right around the same time that Bitcoin went from $10,000 to $20,000. The primary reason why $LFIN saw so much trading volume was simply because Bitcoin was running as well, and they shared the cryptocurrency industry (this is also called a Sympathy Play)
These industry catalysts happen all the time. Some examples of industries that have had massive catalysts are:
- Cannabis
- Military Industrial Complex
- Coronavirus
- Natural Resources
The Cannabis craze of 2018 spawned plenty of stocks that went on huge parabolic runs.
2. How Float Affects Small Cap Penny Stocks
Float is an extremely important component when it comes to a stock.
As you remember earlier, price is fundamentally driven by supply and demand.
Float simply refers to the amount of shares that are available to be publicly traded and is calculated from subtracting Restricted Shares from Outstanding Shares. Float is important because of how the supply and demand equation works.
We know that if demand is higher than price, the price of a stock will raise.
If a stock has a small float, then it is a lot easier for the amount demanded to surpass the available supply, meaning the stock can reach a much higher price.
For example, $WORX from above has a 4.9 million share float (data displayed from www.finviz.com)
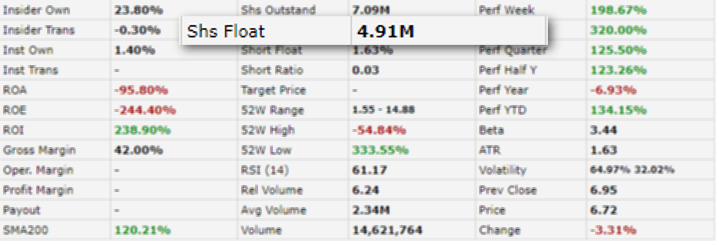
The small float means that it wouldn't take an outrageous amount of buying volume in order to create an extremely high demand when compared to how much supply there was.
In fact.. on the day that $WORX released their news, the stock had 96,182,928 shares traded!
This is 19 times more than the amount of available supply (also known as a 19 times float rotation)
Its no surprised that $WORX ran so high when broken down that way!
How Money Supply Affects Float
When considering float, you need to be sure that you're understanding the deeper fundamentals of what it is referencing to. One of my favorite pieces of data when it comes to analyzing stocks is Dollar Volume (also seen referenced as $ volume) The reason for this is because volume by itself can be very misleading on a wide range of stock prices.
If you wanted to purchase $1,000 worth of a $1/share stock, you'd get 1,000 shares. In contrast, if you wanted to purchase $1,000 worth of a $0.01 share stock, you'd get 100,000 shares!
If you focused on volume alone, you'd be led to believe that the 100,000 share order is a lot larger on the $0.01/share stock.
Dollar volume quite simply multiplies the day's volume by the day's VWAP (volume weighted average price) and gives you a very unique perspective on how much money is flowing through the stock. Having an understanding of how much hype there is (directly correlated with how much people are willing to spend) can give you a massive edge on any stock. In general, the side of the trade that has more money committed to it will be the side that wins (buyers vs sellers)
You can take this a step further by finding out the float's value. You can do this by multiplying the float by the day's VWAP which will give you an exact value for how much money the supply is worth. Now you can compare the money traded today against the stock's float value to gauge how quickly the demand is overtaking the supply.
For example, if a stock trades $5 million dollars before the market even opens at 9:30am (possible with premarket trading) and the float's value is only $10 million, then this is a good indication that there is higher than normal demand for the stock and it has a good chance to spike higher.
Big Floats vs. Small Floats\
To better understand the difference between a stock with a big float and one with a small float, lets take a look at 2 stocks that are polar opposites of each other.
First, we'll take a look at Apple, Inc. ($AAPL) Now im sure that this company needs no introduction. In fact, you're probably viewing this page from one of their devices.
Apple's stock has a float of
3. High Relative Volume
High Relative Volume is pretty simple.
First, lets understand what Average Daily Volume means...
Quite literally, its the average amount of volume the stock has received over (x) amount of days.
This is typically calculated by your broker software or scanner.
I use a script in ThinkOrSwim to show me the average daily volume of any stock I'm watching.
<Insert ToS script picture>
Average daily volume is important for a few reasons..
Lower Average Daily Volume = Easier For Stock To Run
If there is less average volume, this means there is not a lot of previous traders in the stock who will be ready to sell when the stock spikes.
Since we are day traders and want to profit on huge volatility, we need stocks that have huge range.
This means picking stocks that have no resistance.
You can find resistance on the daily chart as well.
One tool I like to use is the Volume Profile.
This combined with basic technical analysis will give you support and resistance levels.
CHAPTER 2:
Trading Terminology
Proper stock selection is one of the most important parts of day trading.
You could do everything else right, but mess up this one step.
Today, the best day traders only take a few trades a day, max.
Typically, day traders don't necessarily trade every day.
In many ways, we spend more time waiting than we do trading.
And in this chapter I'll cover everything you need to know about this important trading trend.
Useful Trading Terminology
There is a ton of terminology when it comes to trading.
We could spend an entire class focused purely on all of the different trading terms.
Theres fundamental analysis terms, technical analysis terms, brokerage terms, and so much more.
To save you time, we are only going to focus on the most important terms in this guide.
For a full terminology guide, visit our Day Trading Terminology section.
Lets get started.
Shares vs. Stocks: What's the Difference?
The difference between shares and stocks has been pretty blurred over the years.
Generally, both represent pieces of ownership in a public company.
The difference between the two words depends on the context of which you're using them.
For example:
You could ask, "How many shares do you have of this company?"
Or say, "What stocks do you own?"
What is trading volume?
In the stock market, trading volume refers to how many shares of a stock are being traded in a given time period. This can be defined as a quantitative value (how many shares have been traded today) or as a qualitative value (does the stock have trading volume) For traders, volume is important because it implies volatility. If a stock has trading volume, it means that money is flowing through it.
Float: A Quick Definition
Float is one of the most important concepts for day traders to understand.
It refers to the amount of shares that are available within the supply pool
