Volume Weighted Average Price (VWAP): A benchmark indicator that gives the average price a security has traded at throughout the day, based on both volume and price.
VWAP is a very powerful indicator, and is in fact one of the only indicators that I use on my charts when I trade. If used correctly, it can provide deep insight into the current structure of ‘the move’ and allow you to effectively maximize your profit potential and at the same time, help you understand when it is time to jump ship and exit the trade. Keep in mind that the content on this page is meant for small cap day trading, specifically low float stocks. In the video below, I will explain exactly what the VWAP indicator is and how it’s calculated, and how to use vwap when day trading small cap penny stocks.
Sign up for our FREE trading course
Watch the video below for an in-depth explanation of VWAP!
How VWAP Looks:
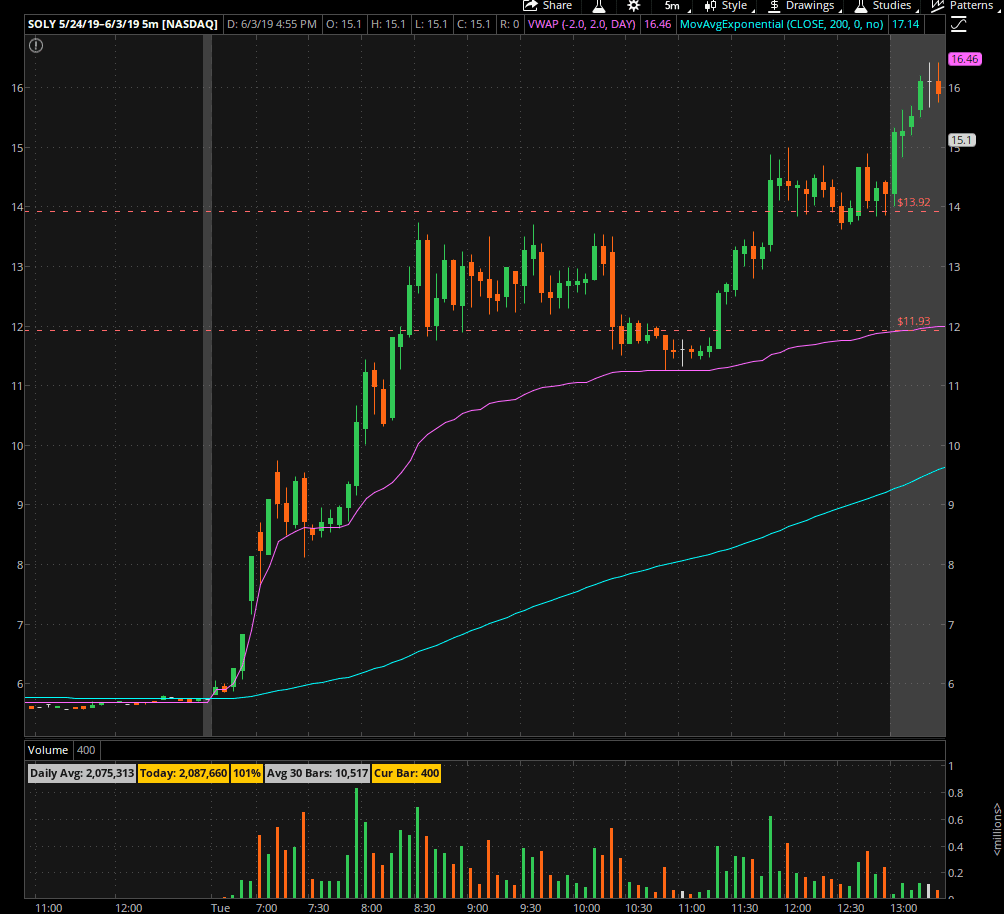
The pink/purple line on the chart above is the VWAP indicator when displayed on E-TRADE PRO charts
Key Takeaways
- The Volume Weighted Average Price (VWAP) appears ONLY on intraday charts (1 min, 5 min, 15 min, etc.) and will NOT show up on daily charts.
- Because of this, VWAP calculations are reset at every market open
- In general, if the stock is above VWAP, it is considered bullish, if it is below vwap, it is considered bearish
- Don’t rely on VWAP exclusively to determine price action and trend, be sure to utilize basic support and resistance principles as well
Using VWAP to read price action
One important thing to understand about VWAP is that it resets at every market open. This means that, in general, the volume and price action during the morning will dictate which way VWAP will go. (Think of it as the morning volume is weighted more heavily since it is the starting vol for the calculation)
For example, take a look at SOLY on the right. The purple/pink line is the VWAP, and volume is listed at the bottom. In the morning, there was extremely high volume followed by a huge surge in price. Within the first hour or so, the stock spiked from $6 to around $14 on large volume. You can see that because of this massive morning volume, the VWAP was able to stay close to the price and give it support on the way up.
Another thing to note about this chart is how VWAP acted as support at 2 critical points on SOLY’s move. This is largely caused by institutional banks and mutual funds choosing to enter at VWAP since it is considered ‘the point of most liquidity’
As noted before, in general if the stock is above VWAP it is considered bullish, and VWAP can be used as a sort of support level. When the stock is underneath VWAP, it can be considered a resistance level.
Another thing that you can use to your advantage is understanding price action in relation to VWAP. I explain this a lot more in depth with TradeBuddy University students (find out more here…) but, in general, the first big push over VWAP will almost always have a dip down to VWAP. This means that you do NOT need to sell at the first signs of a pullback, because the stock can very easily pull back to VWAP and then break higher. It is only time to sell once the stock puts in a LOWER HIGH after bouncing vwap, and then cracks the VWAP line.
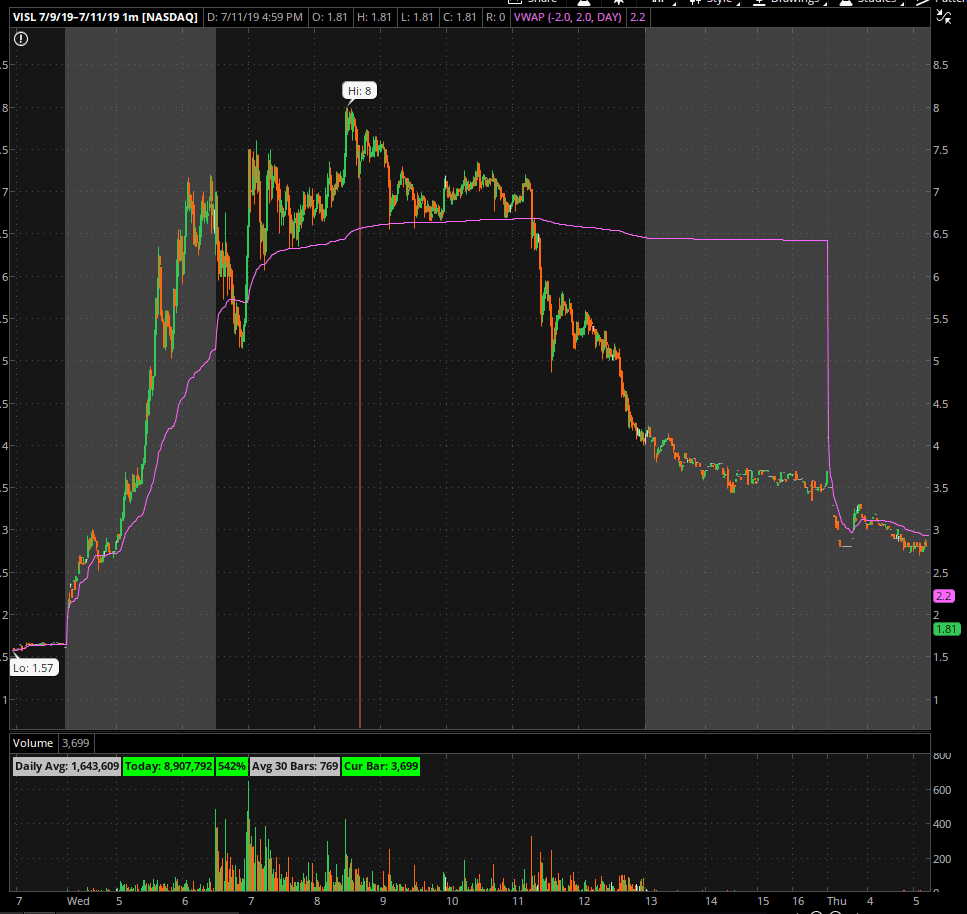
VISL is another good example of how VWAP can be considered support and resistance, and can help you identify the ‘backside’ of a move; when the stock is truly done for.
Notice that after it hit highs of $8.00 and started to make a descending triangle against VWAP. If I saw this happening live, I would prepare to get stopped out if it breaks VWAP, because that would be a bearish downtrend move. Once it finally broke the VWAP on significant volume, it tanked a ton. Usually, whenever we see a crack from front-side to back-side, we see a bounce that rejects VWAP (thus confirming the new trend) but in some cases, when the sell-off is simply too strong, there will not be a bounce.
I hope this helps you understand a bit more about price action in relation to VWAP and how you can use it to your advantage when trading. Remember, VWAP can only be used on intraday time frames, so don’t freak out if it is not showing up on your daily chart.
Want to learn more about trading, but don’t have the cash to buy a course? Sign up for our FREE trading course that will help you with the mentality and psychology of trading, not just basic chart patterns that you can google easily! Click here to sign up.
Do you use VWAP on your charts? Have you found any success with it? Let me know below!


July 25, 2019
I love Tony’s curriculum and thanks for this reminder of how important VWAP is!